"SEC | S20W1 | Spreadsheet Essential For Beginners (Spreadsheet Overview, Spreadsheet Interface & Basic Formulas)
Hello Everyone. I am @shiftitamanna
From #Bangladesh
Image created by Canva.
Assalamu Alaikum everyone.
I am very glad to participate in such a learning course. As an employee, Spreadsheet helps in increasing my work dynamics to a great extent. Spreadsheet is a very useful tool that we need for various tasks in our daily life. Before proceeding with the course task I want to invite some of my friends @mdkamran99, @hotspotitaly and @enamul17 to this course.

Explain your understanding of the Spreadsheet, listing its features, its purposes, and an example image that follows your explanation. |
|---|
Spreadsheet : It is a application program. The literal meaning of which is large paper. Basically, spreadsheet is a computer program that can present a complete picture of any data in the form of a table. So spreadsheets work automatically for processing, calculating, analyzing and reporting any data in less time.
Features :
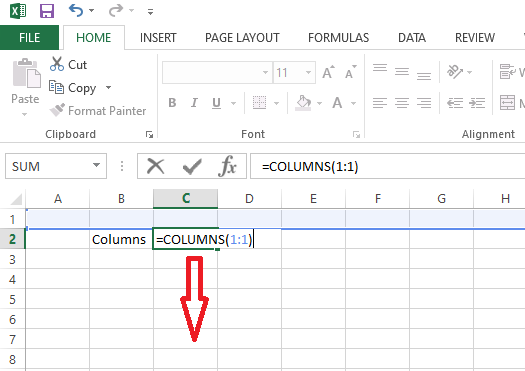
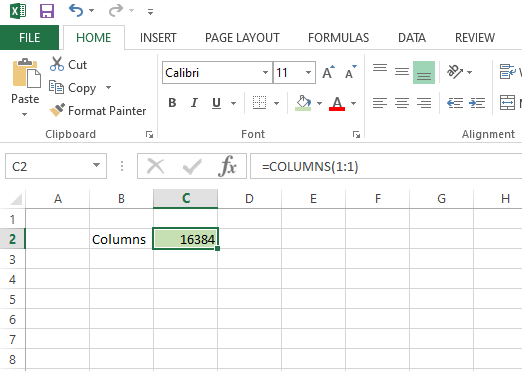
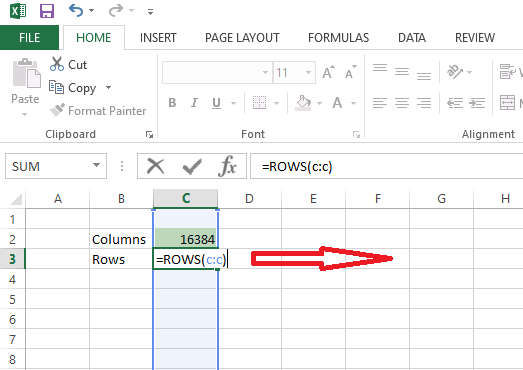
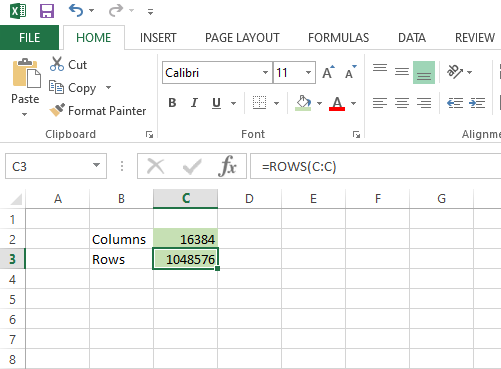
- Structure : The spreadsheet program has a worksheet that is made up of numerous cells. It has 16384 columns and 1048576 rows. Here is an example of how to calculate columns and rows in a spreadsheet.
 |  |
|---|
 |  |
|---|
- Functions/Formula : Spreadsheets have more than five hundred functions to solve a variety of problems. In addition to these, the user can create any function as per his requirement. Also we can calculate addition, subtraction, division, multiplication, average etc. by using different formulas.
- Graphs and Charts : We can present any of our information or data visually with the help of spreadsheets. This includes bar charts, pie charts, line charts, etc.
- Data Formatting : Spreadsheets has changing the font, color and borders to enhance the readability and attractive of our data presentation.
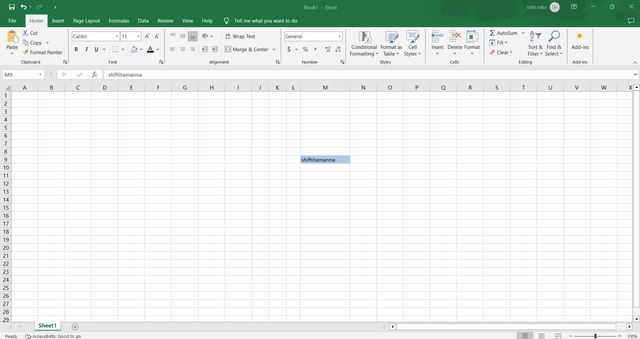
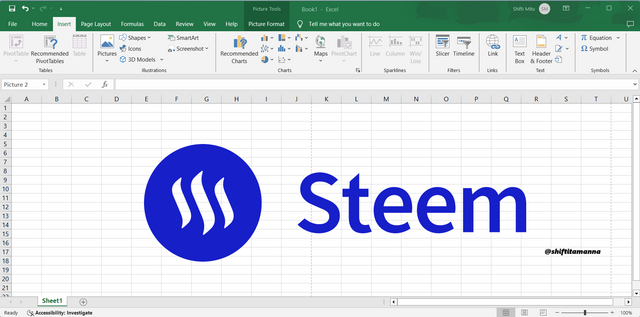
- Audio and Video Add features: Spreadsheets have features for adding audio and video There are also facilities to add audio and video to the presentation. Below I show the process of presenting an image in a spreadsheet:
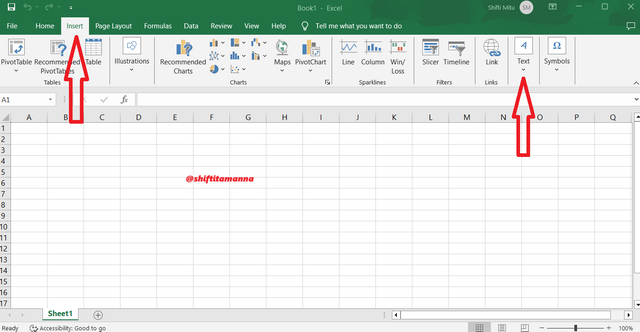
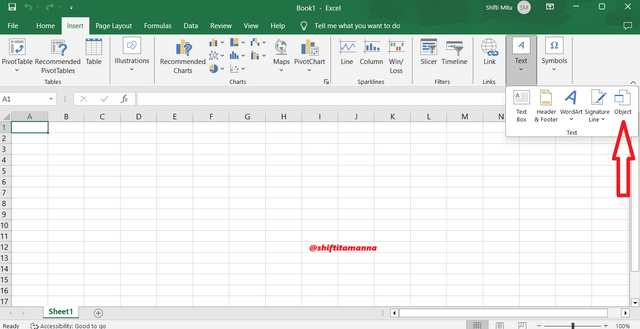
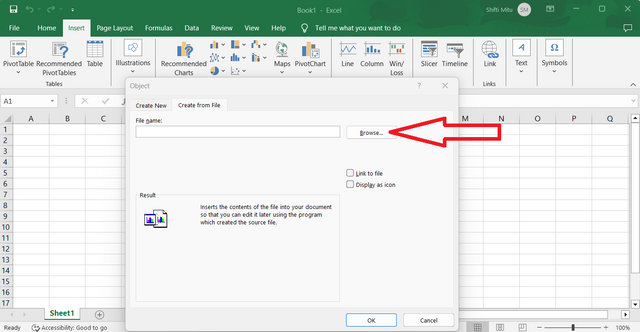
After coming to the interface of the spreadsheet, we will first click on Insert. Then I will click on the text writing feature on the left side. Then when I click on text I will click on object option and go to the next step.
 |  |
|---|
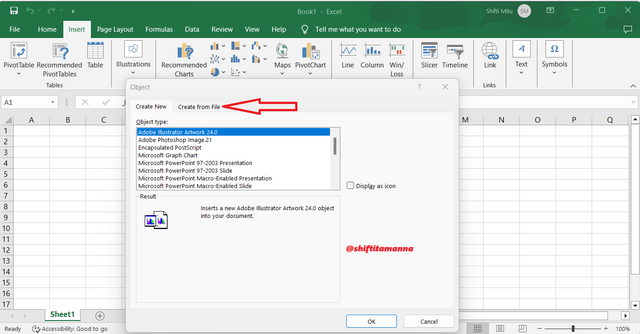
After going to the object option, I will click on Create from file. If you click on browse there, it will immediately take you to the files saved on my computer.
 |  |
|---|
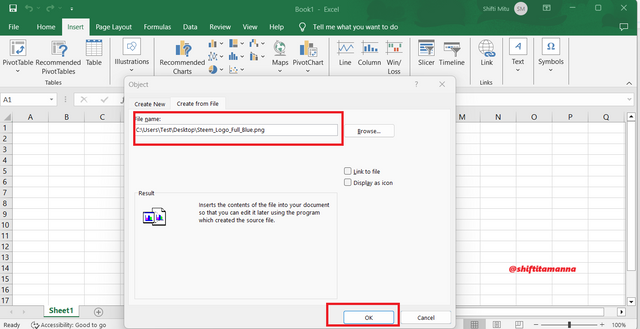
Selecting an image from there will show the address of the image instead of the file name. Then when I click on the OK option below, my image will show in the spreadsheet.
 |  |
|---|
Purpose :
- Work with large amounts of data and information quickly and accurately and reduce time.
- To perform various delicate and complex accounting work of any organization.
- Making charts or graphs to present results for various types of survey work.
- Analyzing market trends on the basis of current data.
- Automate the calculation using formula in calculation.
- Various financial planning budgets can be prepared.
- Management and storage of postal contact addresses and e-mail addresses.
Based on the basic Formulas given in this lecture, use the data below to calculate the SUM Function and the AVERAGE Function of the class. Show clear working as to how you arrive at your answers. |
|---|
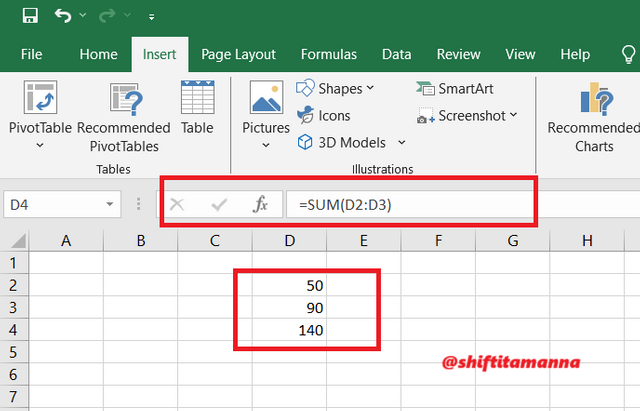
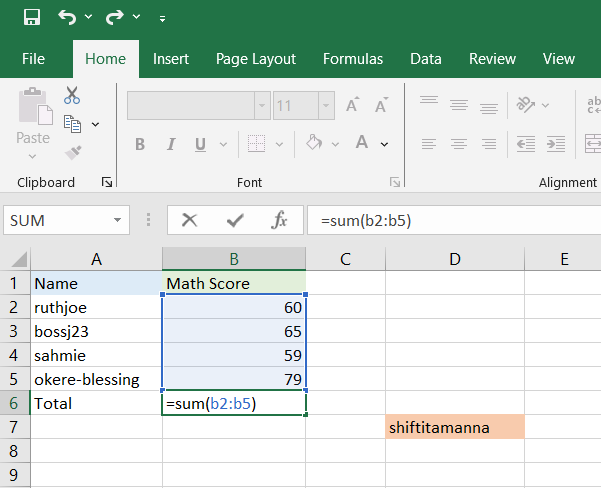
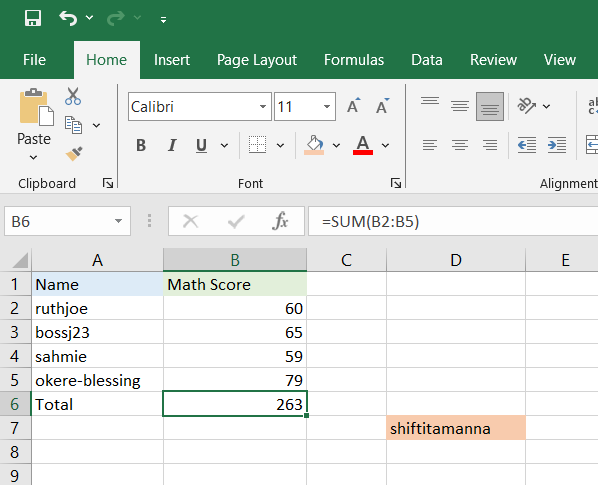
SUM Function : First, by aligning the names and scores, I will add the scores using the formula bar. To do this I will use the formula =SUM(B2:B5). Then clicking enter will add up the scores of the four people.
 |  |
|---|
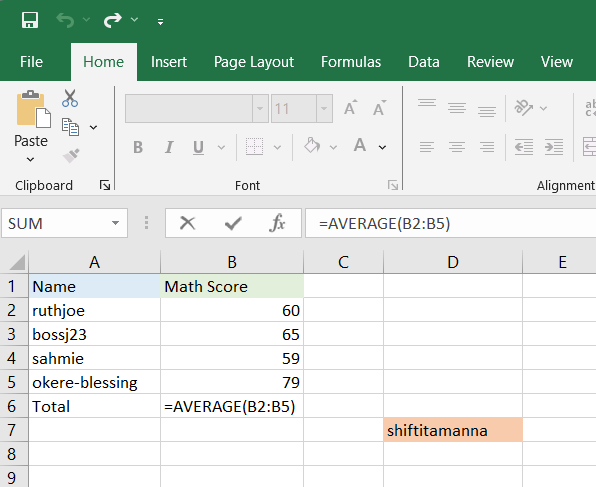
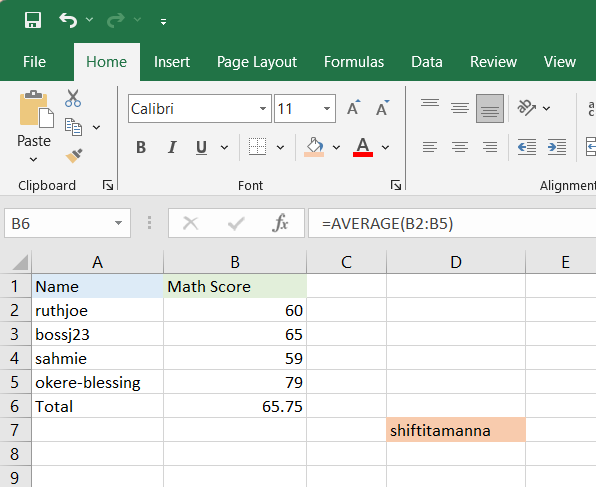
AVERAGE Function : To calculate the average of the scores in the same way, I first need to use the average formula. Here I will write the formula =AVERAGE(B2:B5) in the bar to calculate the average. Then click enter and the average of all scores will be displayed.
 |  |
|---|
Take a screenshot of your worksheet and identify the cell Addresses of the following; N16 with a fill color of black, J8 with a fill color of yellow B5 with a fill color of Green G12 with a fill color of purple and D1 with a fill color of orange. Write your username on these cells using a visible font. |
|---|
| N16 with a fill color of black | 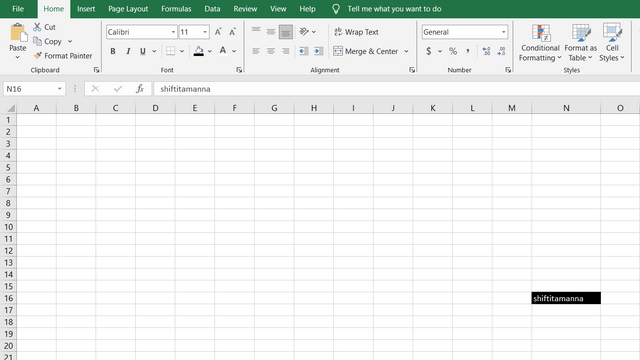 |
|---|---|
| J8 with a fill color of yellow | 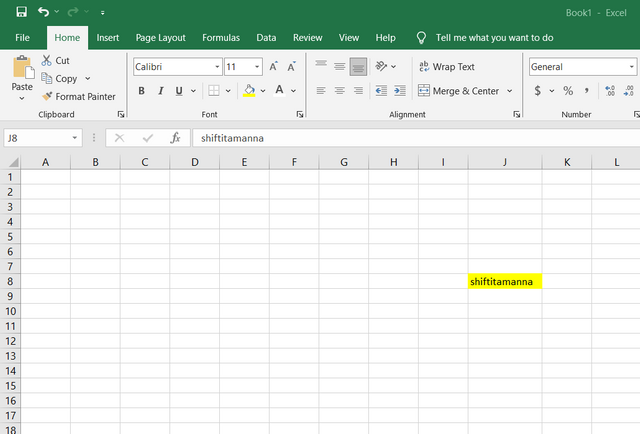 |
| B5 with a fill color of Green | 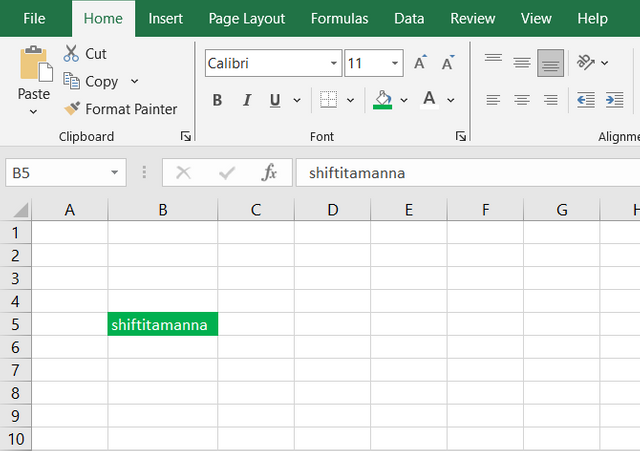 |
| G12 with a fill color of purple | 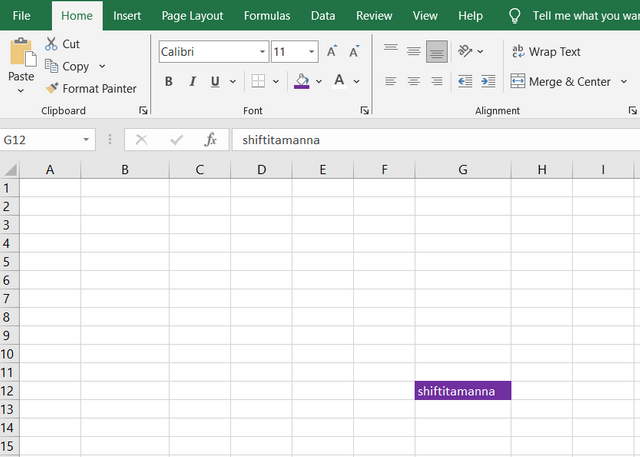 |
| D1 with a fill color of orange | 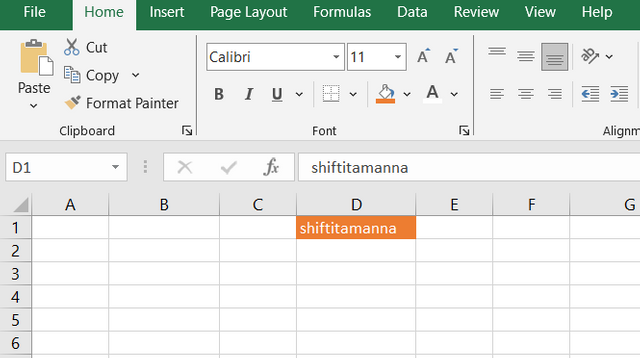 |
Prepare a score for 15 students where the cell A1 label will be Name, cell B1 label will be Maths Score, cell C1 label will be English Score, cell D1 label will be Physics Score, cell E1 label will be Chemistry Score and cell F1 will be labeled Total. Add all necessary information and calculate the total for each student. Show clear working. |
|---|
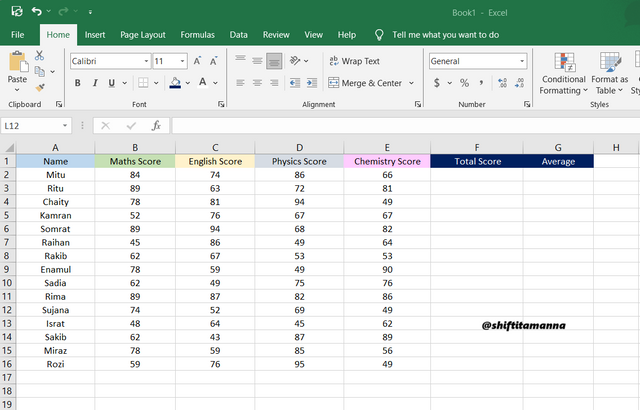
First I will take a blank sheet where I will write the names of 15 people and write the scores of Maths, English, Physics and Chemistry in each cell A1, B1, C1, D1 and E1. Then in the F1 cell I will enter the total score and in the G1 cell the average.
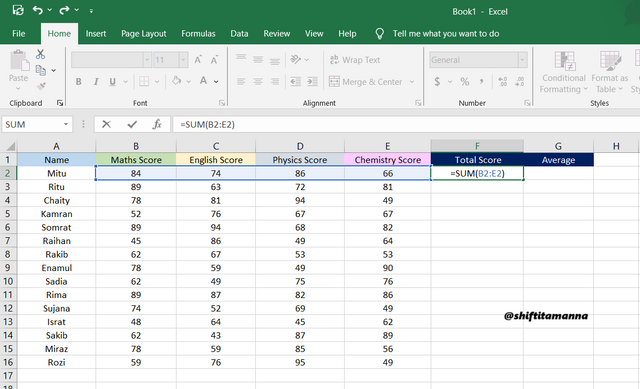
Then I will apply the summation formula. If I place the cursor in F1 cell and type =SUM(B2:E2) and press Enter, the total score of the first person will come out. Then when I click on the cell of the first total score and hold the cursor, a plus sign actually drags it down, the total score of each student will be displayed.
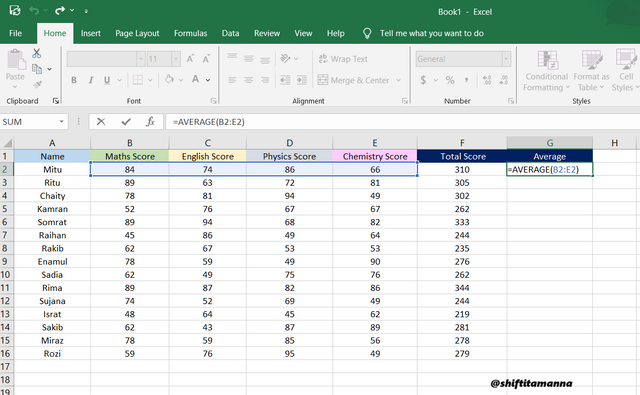
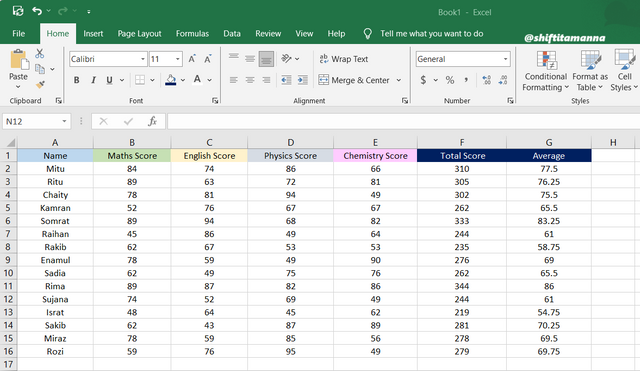
In the same way I will select the G1 cell and write the formula to find the average of the students scores. After entering the formula =AVERAGE(B2:E2) if I press enter the average of the scores will be displayed. And in the same way if I drag the plus sign downwards, the average score of each student will be displayed.
This was my homework from the Spreadsheet Essential For Beginners (Spreadsheet Overview, Spreadsheet Interface & Basic Formulas) course. Really the course is very fruitful for me. I have learned a lot through this course. And I can use them in my work life. So I would like to thank @simonnwigwe and @josepha who taught this course.
Every image in my homework is my own property.
%20(500%20x%2050%20px)%20(1).gif)

I invite you to support @pennsif and @pennsif.witness to grow across the whole platform through robust communication at all levels and targeted high-yield developments with the resources available.

Click Here
%20(2).gif)
Upvoted. Thank You for sending some of your rewards to @null. It will make Steem stronger.
Just read your post. The way you explained the spreadsheet features is really clear. Your data organization and presentation are impressive. Overall you made a good post it is really easy to read and learn from it. Nice work!
Una muy buena explicación de la forma en la que se compone la hoja de cálculo y algunas de las funciones más importantes de la misma. Es importante reconocer cómo este trabajo nos ayuda a obtener resultados más precisos y presentarlos de una forma mucho más ordenada.
Éxitos en su participación.