QQQ Rally Stalls in Afternoon [QQQ Price Update 2/21/2018]

The QQQ failed to hold its gains and sold off during the last hour of trading. But the 4-hour chart remains bullish.
30-Minute Chart
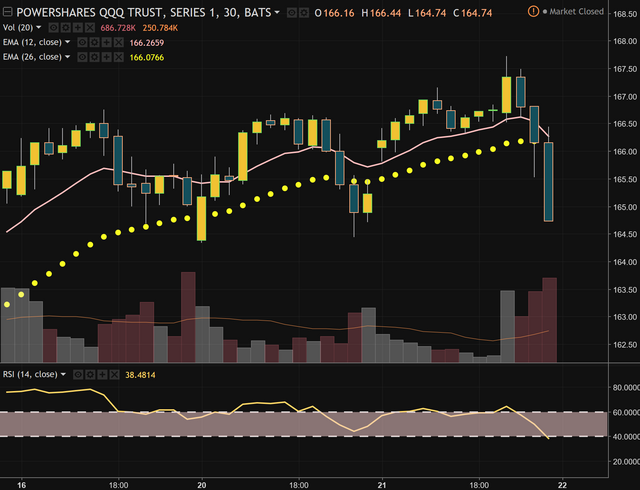
12 EMA: $166.27
26 SMA: $166.08
The 30-minute chart turned bearish during the last hour of trading when the QQQ sold below its 12 EMA and 26 EMA. The fast moving average remains valued above the slow moving average, but QQQ will need to quickly retake $166.30 to resume the bullish trend.
4-Hour Chart
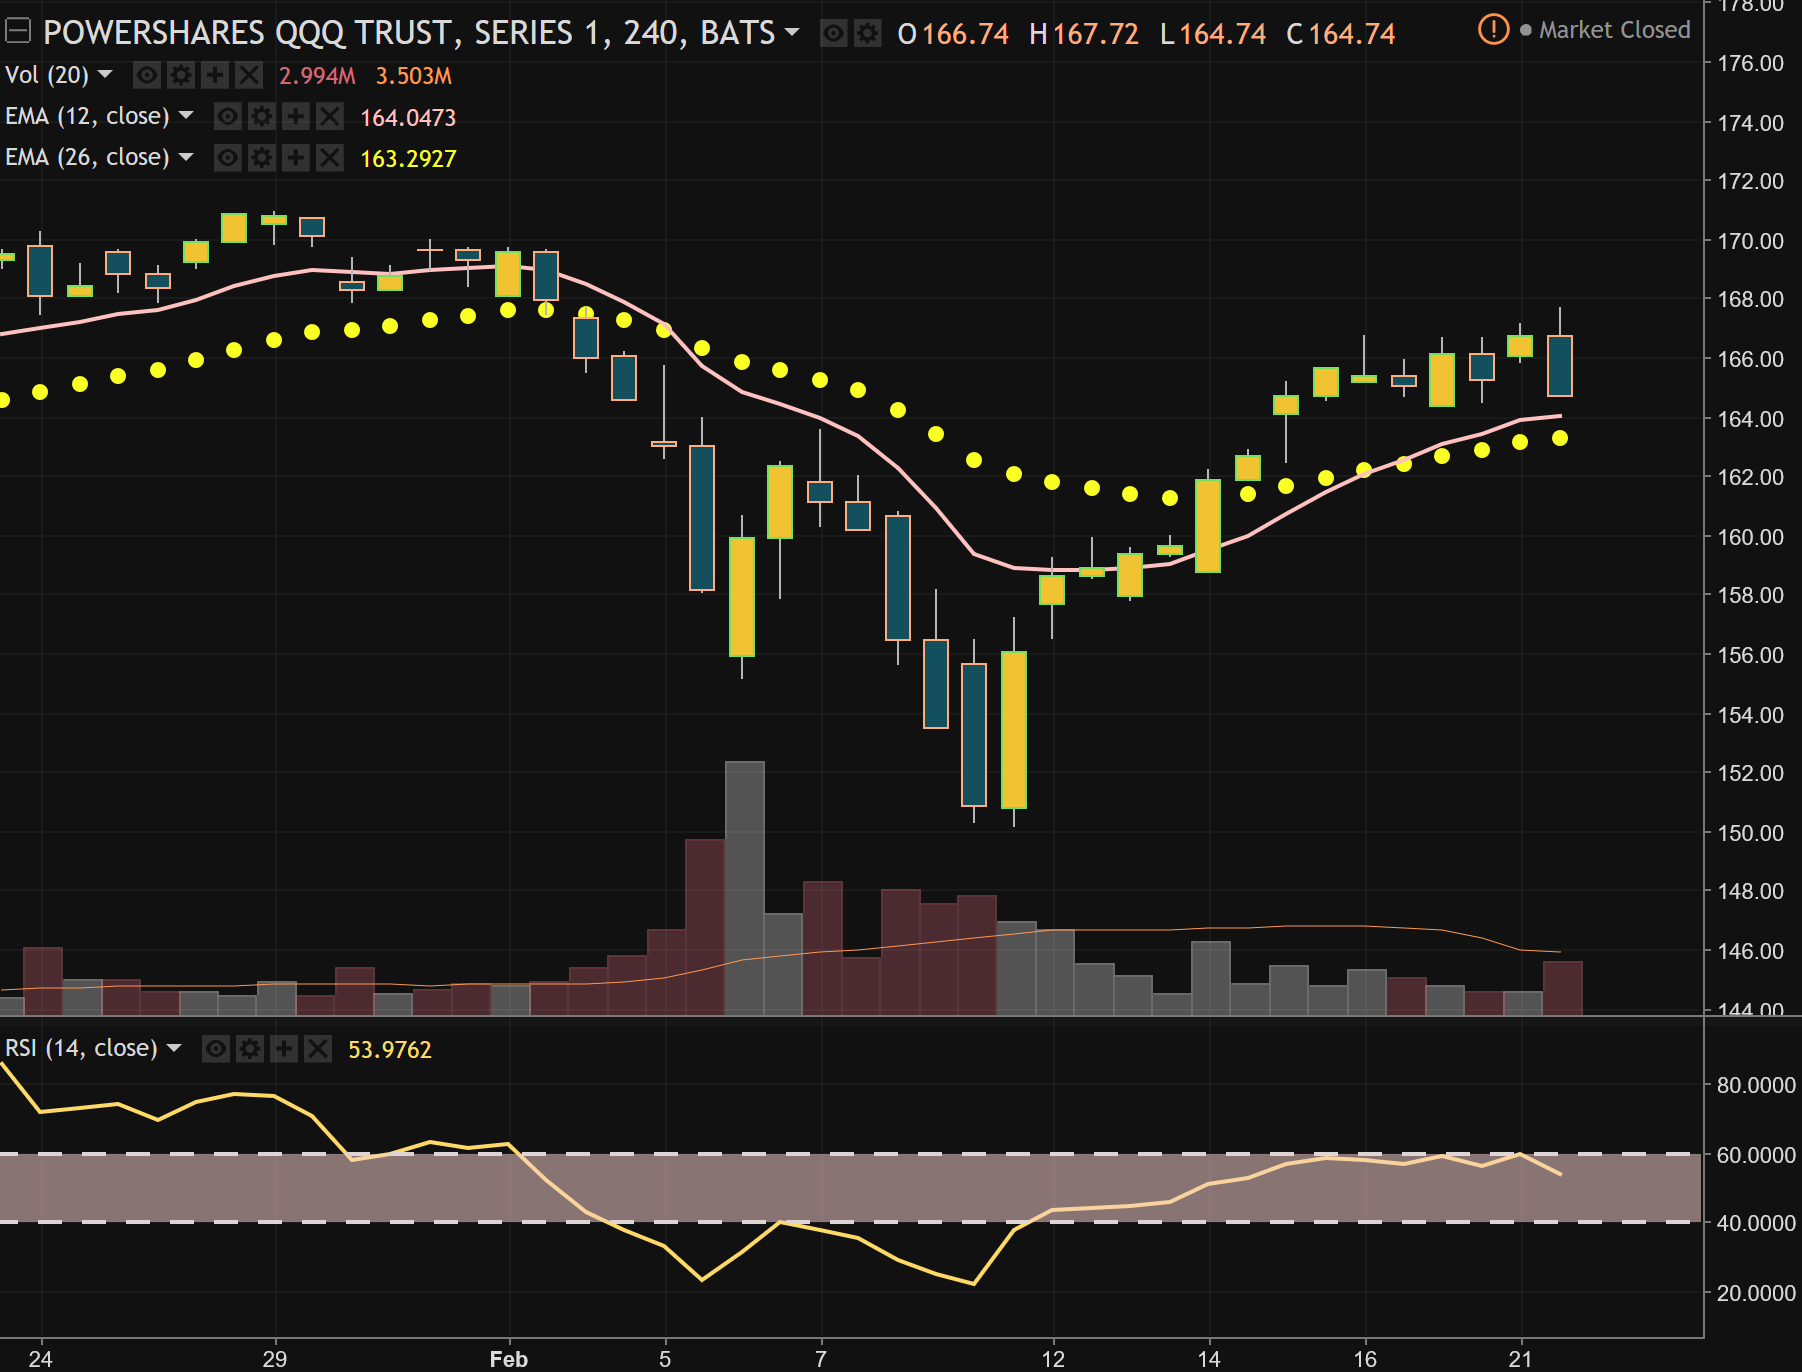
12 EMA: $164.05
26 SMA: $163.29
On the 4-hour chart, the recovery from February lows remains intact as the 12 EMA is still valued above the 26 EMA and the QQQ trades above both moving averages. The first line of support comes in at $164.05 at the 12 EMA. A close below $163 would call into question the strength of the rally.
DISCLAIMER
This post is for information and illustrative purposes only. It is not, and should not be regarded as “investment advice” or as a “recommendation” regarding a course of action.
SUPPORT
Bitcoin: 19498NLGwLbzN7yKrNbYqc4wuwZPkTGMVD
Ethereum: 0x76F2D78c81C6C97473DaF2aa3219F78Ce8C5A92f
Litecoin: LNhKXYTC5t2ZxcKYfo3pMzk8QsjZXsEbgT
CONTACT
twitter: sjanderson144
instagram: sjanderson144