180512 비트코인 차트분석 [주봉의 향방]
안녕하세요.
많이 힘드시죠.. 조금만 더 버티시면 될 듯 합니다.
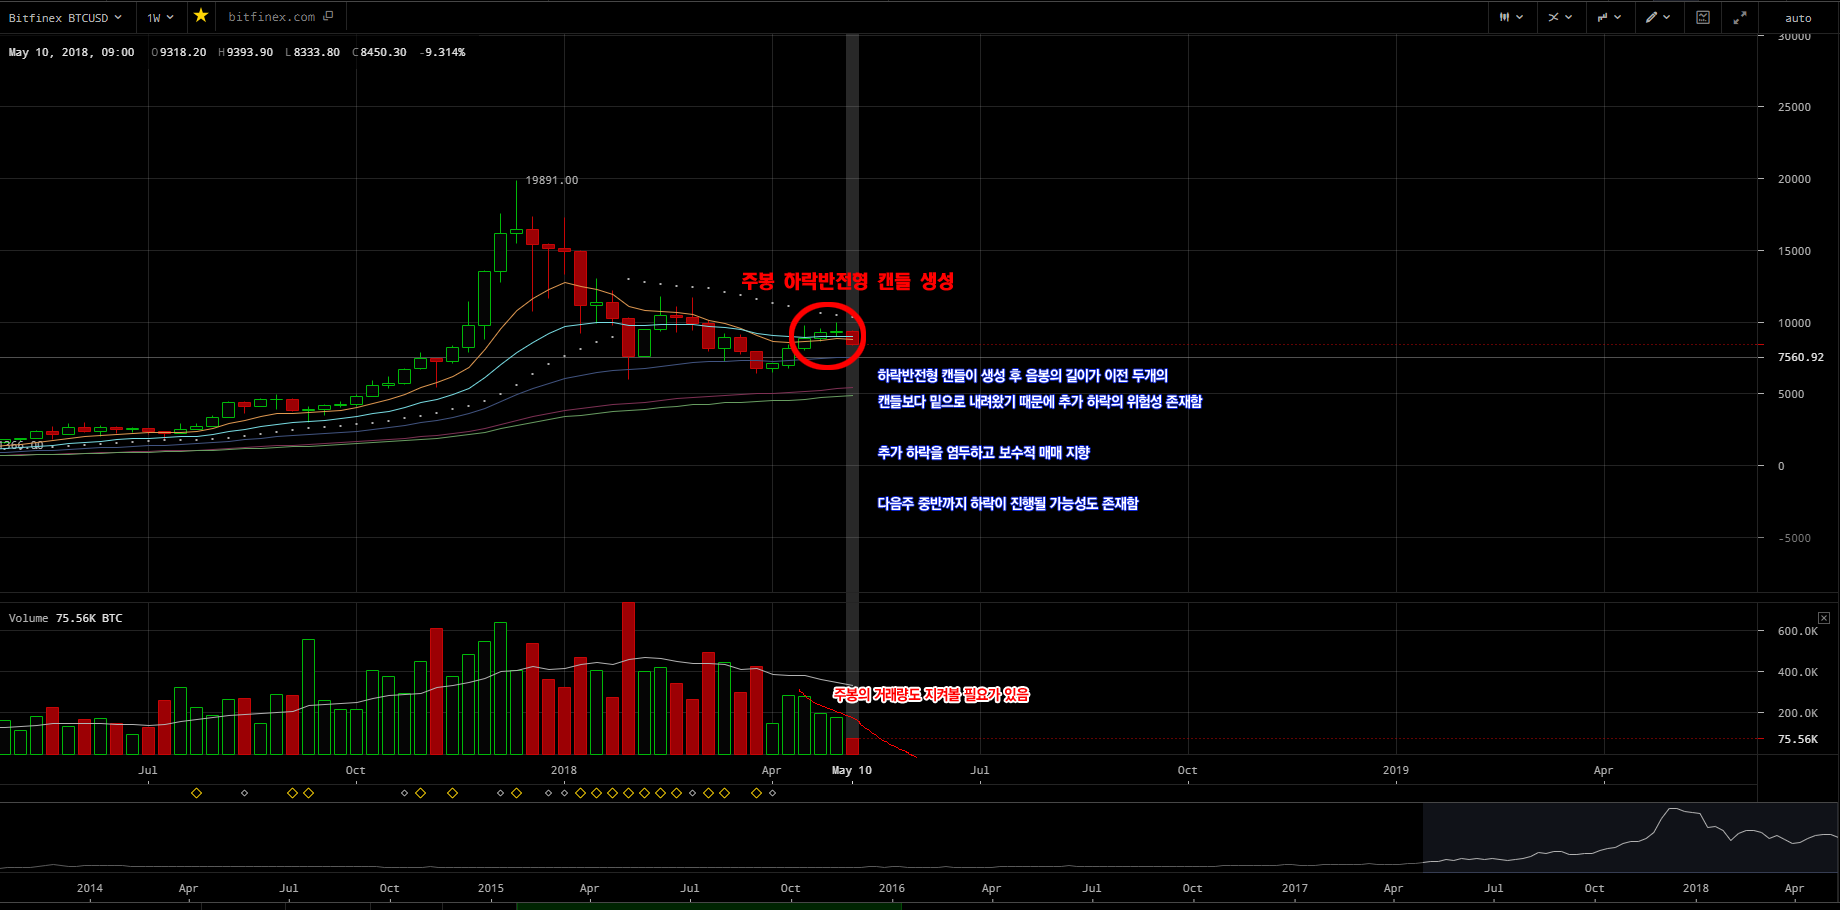
현재 주봉의 움직임으로 큰 그림 부터 살펴본다면 다음주까지 추가하락의 가능성이 존재합니다. (개인적으론 최대치 일 것으로 예상)
거래량도 점점 줄어들고있고 줄어드는 추세와 각으로 볼때 길어야 다음주고 다다음주부터는 반등하며 상승할 것으로 예상됩니다.
다음은 일봉입니다.
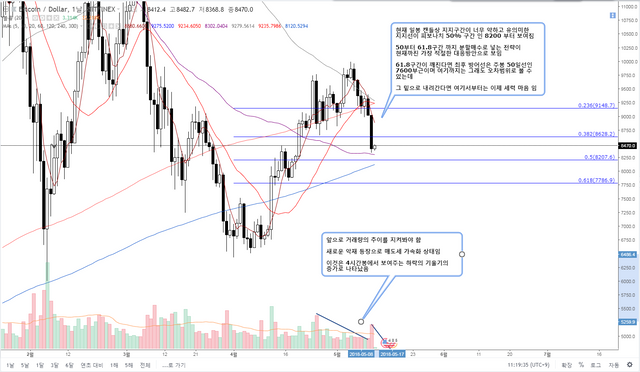
현재 일봉 캔들상 지지구간이 너무 약하고 유의미한 지지선은 피보나치 50% 구간으로 보이며 50%~61.8%구간 (8200~7800) 으로 보입니다.
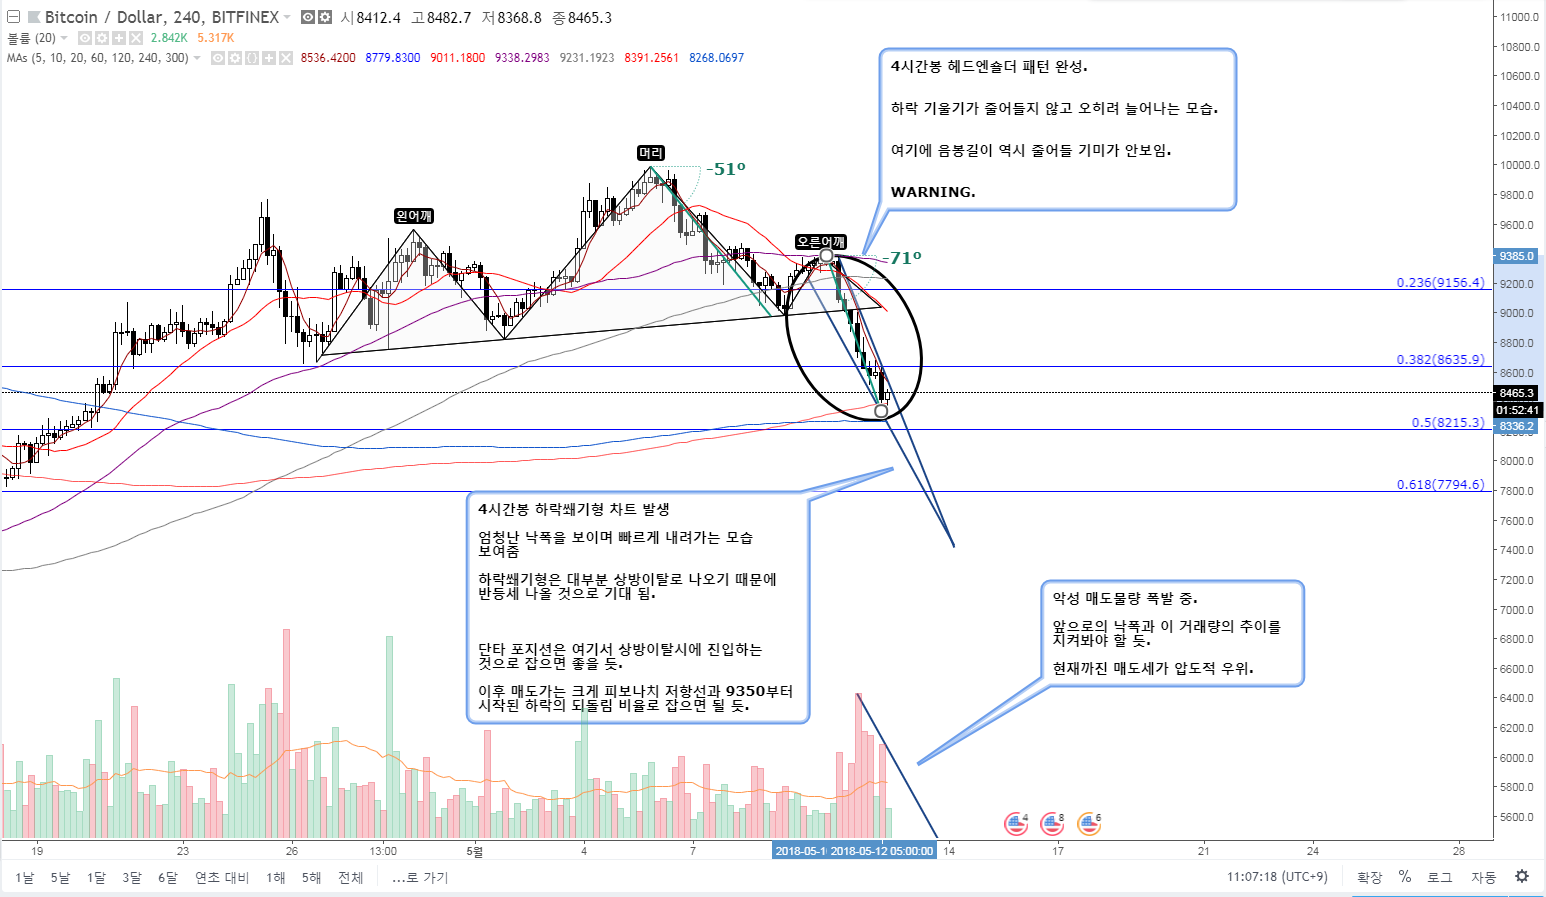
4시간 봉으로는 헤드앤숄더 패턴을 완성하였으며 하락의 기울기가 줄어들지 않고 오히려 늘어나는 중입니다.
아직까진 여전히 매도세가 강한 모습으로 보여지며 여기에 업비트 관련 추가 FUD 재생산으로 인한 악재가 나올 것으로 보여 단타관점으로 신중히 접근하는 것이 좋아보입니다.
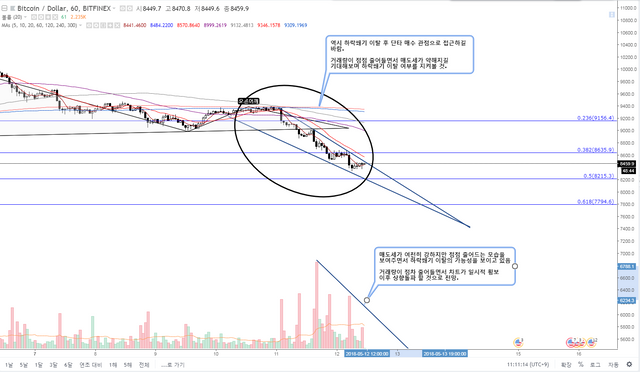
1시간봉 역시 하락쐐기가 더욱 잘 보이는데, 매도세가 여전히 강하지만 거래량으로 보면 점점 줄어드는 모습이 보입니다. 거래량이 줄어들면 이 것은 횡보와 수렴의 모양으로 차트에 그려질 가능성이 높은데 단기 추세의 변환을 기대해 볼 수 있겠습니다.
단타 관점으로 하락쐐기 상방이탈에 무게를 둘만한 모습입니다.
단타 관점을 제외한 매수 관점으로는 크게 세가지 가능성에 대한 대응이 필요하다고 봅니다.
현재 예상가능한 시나리오는
- 8200에서 피보나치 50의 지지를 받아 상방쐐기 이탈과 맞물려서 하락 끝.
- 8200~7800사이에서 하락 끝.
- 주봉 관점으로 볼때 한주 더 갈 가능성과 업비트 추가 FUD 재생산의 영향으로 주봉 50일 선인 7600에서 아래 꼬리를 만들며 61.8 구간의 오차범위로 여기게 만든 후 반등 (여기에는 8800을 보던 대부분의 트레이더들이 8200과 7800을 보기 시작해 이 지점을 과연 고래들이 내어줄까 라는 생각으로 만든 시나리오 입니다)
입니다.
여기서 대응 방법은
- 지지구간 및 단타 자리에서 단타만 하고 추세가 바뀔때까지 기다림
- 8200 부터 분할 매수 돌입 (이 것도 현금 비중 필수)
- 완벽한 추세 전환 이후 확인매매
이렇게 크게 세가지로 볼 수 있습니다.
매매는 각자의 성향에 따라서 대응해 나가면 되겠습니다.
http://cafe.naver.com/gatooka/4610
거래소 악재와 블록체인 컨퍼런스를 통해 본 [호재와 악재]
http://cafe.naver.com/gatooka/4534
조정이 끝나고 난 뒤~~~ 의 장세 전망
추가적으로 대응 전략에 참고하시면 좋을 듯 해서 지난 글 가져왔습니다.
그럼.
Hi.
It's a lot of trouble ... I think you can stay a little longer.
If you look at the big picture from the current main movement, there is a possibility of further decline until next week (the maximum personal figure)
The volume of transactions is also decreasing and the trend is decreasing and it is expected to rise from next week and next week.
Here's the first thing.
Currently, the support line on the candle is too weak and meaningful, and the support line appears to be 50% to 61.8% (8200 to 7800) in Fibonacci.
The head and shoulder pattern is completed with a four-hour rod, and the slope of the decline is not decreasing but rather increasing.
Until now, the sale is still strong, and it seems to be better to approach it carefully from the point of view because it is expected that the negative result of the reproduction of FUD related to the upbeat will come out.
One hour bar also looks better at the drop wedge, but the sell-off is still strong, but the volume of transactions shows a decrease. If the volume of transactions decreases, it is likely to be drawn on the chart in the form of transverse and convergent, and we can expect a short-term trend transformation.
It is a figure that weighs on the upper part of the drop wedge from the viewpoint of the single.
I think that we need to respond to three possibilities in terms of buying, excluding the viewpoint of Danta.
The current possible scenario
- In the 8200, Fibonacci 50 received the support and ended the decline with the departure of the upper wedge.
- A fall between 8200 and 7800.
- From the viewpoint of the main point of view, the possibility of going one more week and the effect of the upbeat FUD reproduction, the tail of the main 50 days line 7600, the bottom of the 61.8 section,
It's .
the counter method here
- Wait for the support section and the place to change until the trend changes.
- Starting with the split-off bid (and this is also required for cash) from 8200
- Confirmation trading after a complete transition
So, there are three things that we can see.
We can deal with each other according to their tendency.
http:/cafe.naver.com/gatooka/4610
The Study on the By the Good and the Bad through the KRXs Negative and Block Chain Conference
http:/cafe.naver.com/gatooka/4534
The Prospects of the Long-Terms of the Korean-American after the Adjustment
In addition, I would like to refer to the response strategy.
So...
좋은정보 감사합니다
읽어주셔서 감사합니다~
Vote exchange site https://mysteemup.club