Top Down Analysis Of ETHUSDT Using Support And Resistance Strategy And RSI Indicator As Confluence

Hello great minds,
It is a great opportunity to come before you all today to share my technical analysis on eth against usdt.
I believe you are all doing perfectly well and are enjoying your activities in the community as you actively promote steemit across various social media platform.
Ethereum is a very big cryptocurrency in the cryptospace and we are well aware of this.
Ethereum happens to be the second most biggest and popular cryptocurrency in the cryptospace.
After Bitcoin which is the driver of all other tokens, ethereum is known to be the next most valuable token, and I am here to share my analysis to it.
ANALYSIS USING SUPPORT AND RESISTANCE STRATEGY
I begin my technical analysis from the higher timeframe, then I descend to the lower timeframe
On the higher timeframe, ideally the monthly timeframe, I seek to determine market trend
The monthly timeframe helps to eliminate market noise from the market and also compress the market to one screen.
And from this, it becomes very easy for the market trend to be predicted.
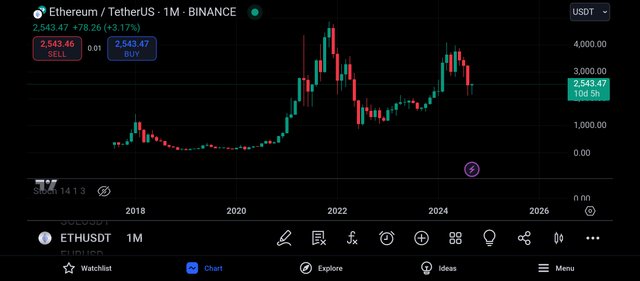
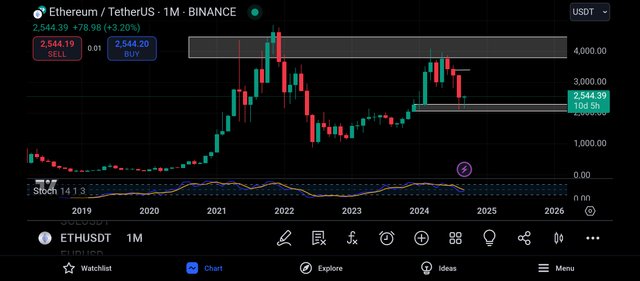
The screenshot above is that of the pair ethusdt on the monthly timeframe.
And as seen above, there are lesser candles on this timeframe and this is as a result of the time it takes for one of this candles to be formed.
On the monthly timeframe, it takes the time period of 1month for each candle to be formed.
And also, it is easy for the overall trend of the market to be detected on this timeframe, as we can see that the market is being bearish.
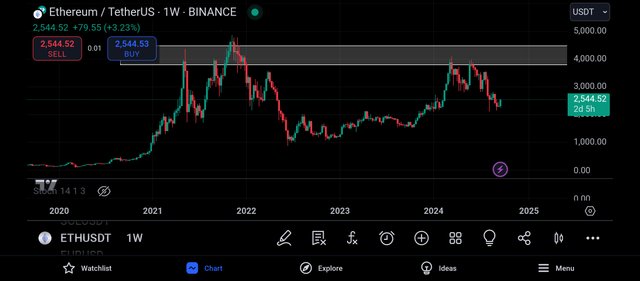
I then continued my analysis on the weekly timeframe, and on this timeframe, I could see the market more clearly, I could see more candles as each candle is being formed within the trading period of 7days.
On this timeframe, I was able to identify a key level and this level is functioning as a resistance level to the market price, and it is expected for the market to be rejected when it trades towards this level.
On this level, there are more sellers than buyers which is why the market is unable to break above it.
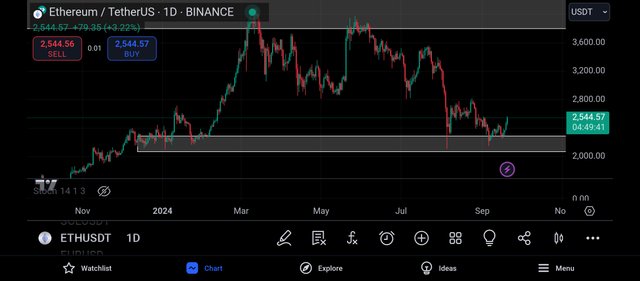
Getting to the daily timeframe, I could see the market more clearly, I could see series of buys and sells in the market.
And I was able to identify another key level and this level is functioning as a support level to the market price.
And from the above screenshot, we can see that the market has made several touches on this level and had been unable to break below, which shows the validity of this level.
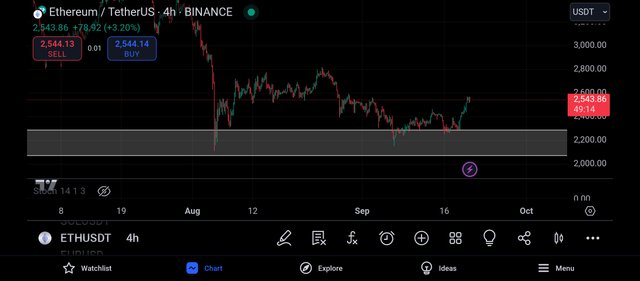
And getting to the 4hr timeframe, I could see the market more clearly, I could see lots of noise in the market which indicates the presence of buyers and sellers.
And looking carefully, I could see that the market has been rejected from this support Level and we can expect the market to trade towards its resistance level.
And then I moved to the 2hr timeframe in search of entry into the market, as it is on the 2hr timeframe that I take my entry into the market.
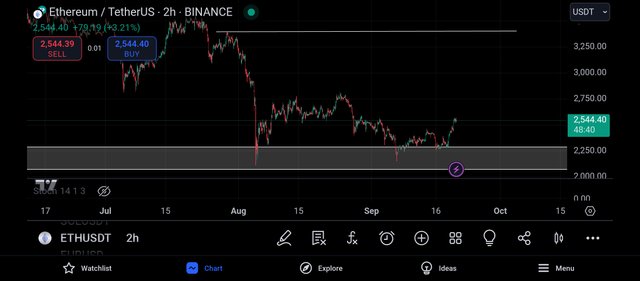
And moving to the 2hr timeframe, I could see the market more clearly, I could see lots of joy in the market.
I could feel the presence of the buyers and sellers as they struggle to drive the market to their preferred direction.
And I was able to identify another level and this level will be functioning as my take profit position, and with this, I decided to search for trading confluence using the relative strength index indicator.
CONFLUENCE USING RELATIVE STRENGTH INDEX INDICATOR
The relative strength index indicator is an indicator that helps to identify overbought and oversold market.
When a market is spotted to be overbought, it is a bearish trend reversal signal and when it is oversold, it is a bullish trend reversal signal.
An overbought market can be spotted when the rsi crosses above the 80% line and an oversold market is detected when the market crosses below the 20% line.
From the above screenshot, I can see that the market is about to be oversold and an oversold market can be detected when the rsi crosses below its 20% line.
And when this happens, we can expect to see the market embark on a bullish trend reversal.
An oversold market signals the weakness of the bears and the strength of the bulls in the market, and as such, we can expect to see some bullish candles.
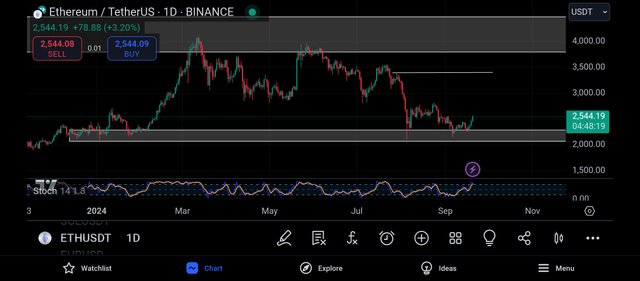
And on the daily timeframe, I could see that the market is being overbought and an overbought market can be detected when the market crosses above its 80% line.
And an overbought market can be seen to mean a bearish trend reversal of the market, it indicates the weakness of the bulls and the strength of the bears in the market.
And then i decided to move to the 2hr timeframe in search of my entry into the market.
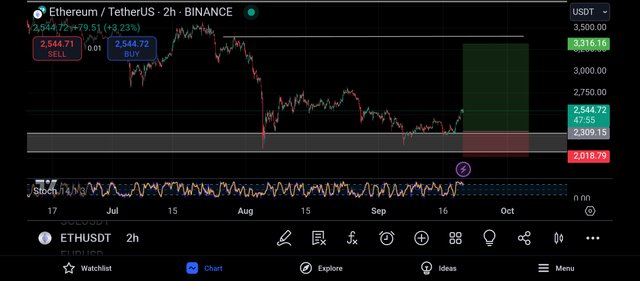
On the 2hr timeframe, I decided to search for buy opportunities into the market.
And I decided to place my entry on the closest support level to the market and my take profit was placed on the closest resistance level to the market, just as seen above.
CONCLUSION
I have shared my analysis on ethusdt beginning from the monthly to the weekly to the daily and to the hourly.
From my analysis, I expect to see a bullish move on ethusdt.
https://x.com/JuecoYoung/status/1837229437542355125
Upvoted! Thank you for supporting witness @jswit.
!upvote 20
💯⚜2️⃣0️⃣2️⃣4️⃣ Participate in the "Seven Network" Community2️⃣0️⃣2️⃣4️⃣ ⚜💯.
This post was manually selected to be voted on by "Seven Network Project". (Manual Curation of Steem Seven).
the post has been upvoted successfully! Remaining bandwidth: 30%
Your post has been rewarded by the Seven Team.
Support partner witnesses
We are the hope!