Technical Indicators - Crypto Academy / S4W2- Homework Post for @reminiscence01
Hello Steemians,
It is really pleasure to take part in the home work tasks session in this week. Prof. @reminiscence01 explained really well about the technical indicators which is a most usable too in trading. I will arrange my content in this article as per the given questions below.
Image edited from www.canva.com
- a) In your own words, explain Technical indicators and why it is a good technical analysis tool.
b) Are technical indicators good for cryptocurrency analysis? Explain your answer.
c) Illustrate how to add indicators on the chart and also how to configure them. (Screenshot needed).- a) Explain the different categories of Technical indicators and give an example of each category. Also, show the indicators used as an example on your chart. (Screenshot needed).
b) Briefly explain the reason why indicators are not advisable to be used as a standalone tool for technical analysis.
c) Explain how an investor can increase the success rate of a technical indicator signal.
01. (a) Technical Indicators
Before being learnt about the technical indicators, let me bring you through the analysis concepts in trading. Trading shall be done in a better understanding otherwise it would not become a trading but would be a gambling.
There are 3 different types of analysis in trading platforms.
i. Technical Analysis
ii. Fundamental Analysis
iii. Sentiment Analysis.
All three analysis shall be considered in trading but technical analysis among them plays a vital role in prediction of future price moment.
What is technical indicator?
Technical indicator is a part of the technical analysis. In the other word, technical indicator is a mathematical model/ mathematical tool which was derived from the data of previous price movements in the market. These derived mathematical tools, so called technical indicators would give a prediction to the future price movements.
There are different kinds of technical indicators which were invented by several mathematicians. But only deriving these indicators would not help to predict the price movements. Therefore, lots of researches have to be carried out to find out the interaction/ interrelation between the indicator and price movements.
After being done the researches, trades can use the technical indicators in a effective manner along with the finding from the previous chart behaviors.
Why are technical indicators better?
As I mentioned above, technical indicators are just a mathematical model. But traders should know that how to use the indicators effectively.
There are logics/ instructions related with indicators. These logical expressions/ instructions will help to identify the future price movements. These logical instructions have been derived after several researches and those instructions along with indicators have already proven that market have been behaved accordingly. Therefore with the past experiences, the technical indicators help a lot to traders.
Since the technical indicators are a mathematical model based on price and volume data, there is an accuracy than the other technical analysis. Also this clearly gives the prediction for future price action.
Therefore we can call the technical indicator as a better analytical tool.
01. (b) Are technical indicator good in crypto currency?
Yes of course.
As the technical indicators play a vital role in every market such as Forex, Stock Exchange, it plays a vital roll in crypto market too.
That is because indicators will give the predictions/ clues on future price action which helps traders to identify their entry and exit points of the market.
Also traders can identify the support and resistance levels while using the technical indicators. Therefore this is good for crypto traders because this is an alarm for the traders.
01. (c) Illustrate how to add indicators on the chart and also how to configure them. (Screenshot needed).
I will explain of using the indicators with Binance exchange.
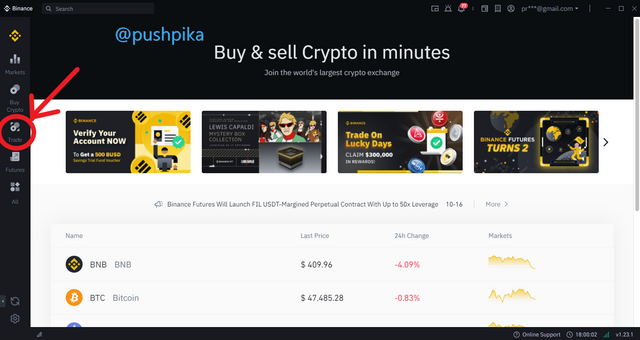
Step 1
I have already created my Binance account for my trading. Open Binance and click on trading.
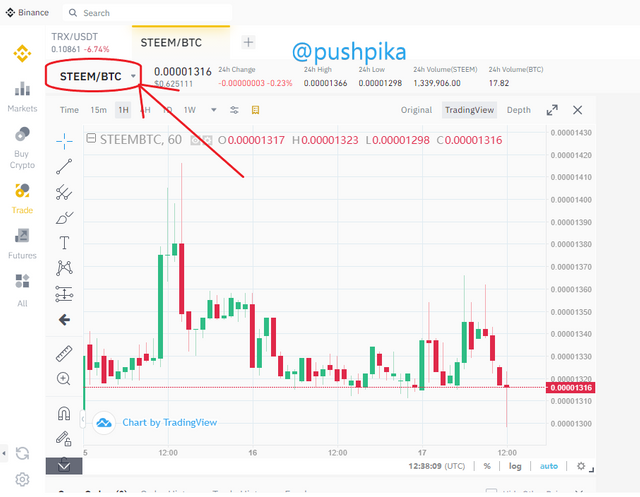
Step 2
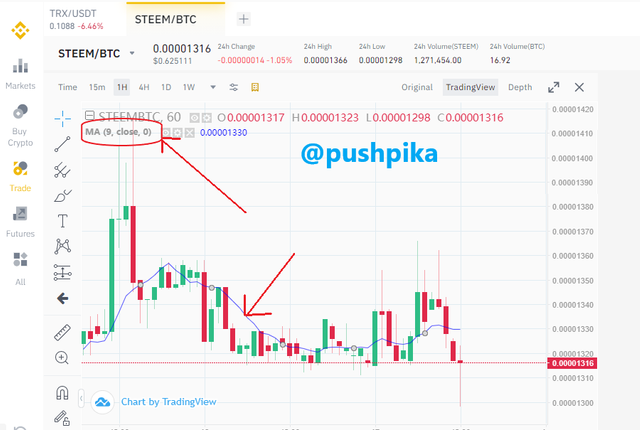
In the red circled line, you can see the currency pairs. Click the drop down menu to see all the currency pairs which was defined to be traded. I have used STEEM/BTC for my example.
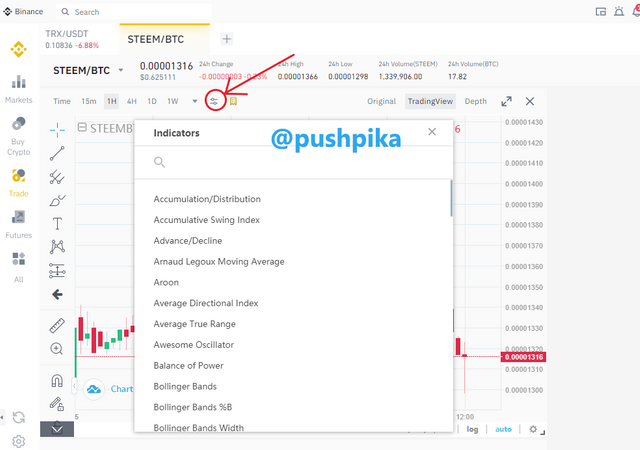
Step 3
Click on the red circled symbol which is for technical indicators. Click on it and then you can find the list of technical indicators. Here I have selected moving average.

Then you can simply modify/ configure the characteristics of selected technical indicator. (Moving average)
Step 1
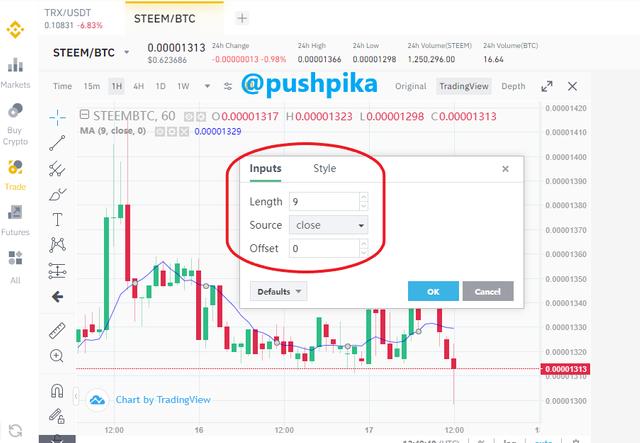
Double click on the drawn line on the graph which was appeared after selecting the particular technical indicator.
Step 2
As you can see in red circle, modification can be done.
There is a box called Length. That means you have used past 9 candles to calculate the moving average.
Offset means that how many candle did you avoid and start to count as length in order to calculate the moving average.
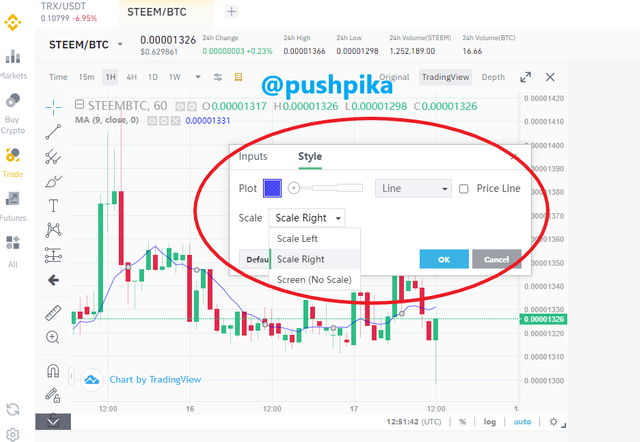
In style menu, you can change the line color, line thickness.
02. a) Explain the different categories of Technical indicators and give an example of each category. Also, show the indicators used as an example on your chart. (Screenshot needed).
There are 2 categories of technical indicators.
i) Leading indicators : This helps to predict price action.
Ex: RSI, MACD
ii) Lagging indicators : This is well about the present market behavior but not to predict the future price action.
Ex: Moving Average
Based on the output characteristics given by technical indicators, it can be divided into 3 groups.
i.) Trend following indicators
ii.) Momentum indicators
iii.) Volatility indicators
Trend following indicators
As it is meant by its name itself, trend following indicators indicates the direction of the trend, strength and the existence of a current trend.
Followings are some examples for trend following indicators.
• Moving average
• Moving average convergence and divergence
• Average Directional Index ( ADX).
• Ichimoku Kinko Hyo
In moving average, the model has been derived based on average value of past candles. More past candles tends more accurate results. Rising moving average tends to an uptrend while reducing moving average tends to an downtrend.
Momentum indicators
By the means of its name, momentum indicators indicate the price momentum. This is called as oscillators also because it helps to identify the price movement speed in order to take the decision on trend reversal.
Normally a market would not follow a same pattern for a long period. When the market get exhausted, the pattern tries for a reversal. So the momentum indicators can predict how long the same trend can prevail or is there any sense of reversal. That helps a lot for the traders.
Followings are some examples for momentum indicators.
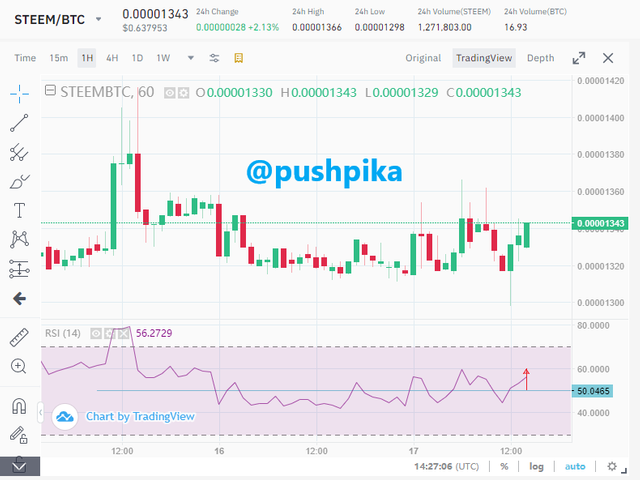
• RSI (Relative strength index)
• CCI (Commodity channel index)
• Stochastic
In RSI (Relative strength index) , it is used the bullish moments versus bearing moments over a given time period in order to identify the strength (or Weakness) of the market.
In RSI, reading above 50 indicates price rising and reading below indicated price reducing.
Volatility indicators
This type of indicators indicate the rate of price action without considering its direction. Based on the market volatility, these indicators are behaved themselves while giving prediction regarding the existence of the present trend, trend reversal.
Followings are some examples for volatility indicators.
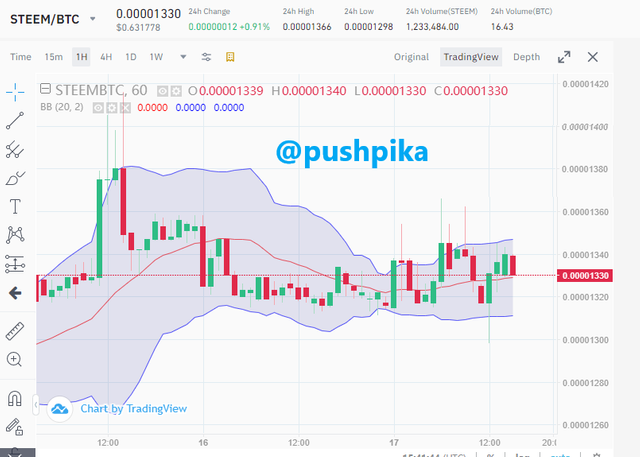
• Bolinger Band
• Standard deviation
• Average true range
In Bolinger band, there are 3 bands called upper, lower and middle. Middle band represents the moving average. Other 2 bands represent the volatility of the market.
Based on the band tightening and expanding, the decision are to be taken.
02. b) Briefly explain the reason why indicators are not advisable to be used as a standalone tool for technical analysis.
As I have mentioned in the very early, technical analysis is only one analytical method among the 3 analytical methods. Sometimes fundamental analysis may be more powerful than the technical analysis, Fundamental analysis means the analysis based on the economic date, relevant third party information on the market.
Also technical indicator is a sub category of technical analysis. Therefore even if some pattern is confirmed with a technical indicator but it would not be followed as predicted because some other powerful effluence may be there to take the price movement away. Therefore traders shall not strictly be with technical indicators only while trading but they have to have vast knowledge on the surrounding / background also.
Also technical indicators are mathematical model but price actions are made by the trades done by human beings. So there can be some mismatches between them.
2.c) Explain how an investor can increase the success rate of a technical indicator signal.
There are numerous technical indicators in the market. Each indicators are different from others and it gives different prediction than the others.
Also the indicators has been derived from mathematical models and historical data, this may give clear picture of future movement. But the trader shall be wise enough to choose the suitable indicator on their trading. Or else they shall try different kind of indicators for one trading and find out the most applicable and powerful prediction giving indicator.
Also indicator gives an idea about the entry and exit points, the trader can determine their profit by setting take profit limits according to the information given by indicator, as well as the setting of stop loss.
By obeying to the above, a trader can increase their success rate by using technical indicator.
I would like to thank to professor @reminiscence01 for your awesome guidelines and make us encourage to learn about the basis of crypto and marketing.
Hello @pushpika, I’m glad you participated in the 2nd week Season 4 of the Beginner’s class at the Steemit Crypto Academy. Your grades in this task are as follows:
Recommendation / Feedback:
Thank you for completing your homework task.
Thank you very much Prof. @reminiscence01 for your great feedback. This motivates me a lot. I will continue the homework tasks in future sessions too.
Hello @reminiscence01.
I am thanking you again for your quick evaluation in my article.
Please kindly let me know whether I am supposed to be voted by @steemcurator02
Thank you