Trading Steem with TD Sequential
Assalam o Alaikum everyone! I hope you will be well and good by the grace of Almighty Allah who is the most merciful and gracious to everyone.
Today I am here to do the homework of the Crypto Academy which is about Trading Steem with TD Sequential. It is really an important topic. A trader must know the basics and the advance concepts of the TD Sequential Indicator. It is of great use. So if you want to learn these advance concepts join Steemit Crypto Academy tasks.
Question 1: Understanding the TD Sequential Indicator
The TD Sequential Indicator was developed by Tom DeMark. It is a tool used to identify the potential trend reversals in the market. It is used to spot the reversals in the market by measuring the exhaustion of the market.
How it differs from other indicators?
We know that there are many famous indicators as well and they are in use for the trading. Moving average, RSI, and MACD follow the action of the price and then they reflect the momentum of the market. But the TD sequential indicator is unique and different from other indicators. Because TD sequential indicator determines the market reversals by using the patterns in the price movements. It uses the previous data of the market to determine the next trend and reversal.
Key differences are given below:
| Feature | TD Sequential | Other Indicators |
|---|---|---|
| Primary Function | Predicts trend reversals. | Typically follows the current market trend. |
| Focus | Identifying turning points for entry/exit. | Riding existing trends or confirming trends. |
| Usage | Useful for traders seeking to anticipate changes in trend direction. | Often used to confirm the strength or continuation of a trend. |
| Approach | Based on counting sequences that signal exhaustion of current trend. | Based on momentum, moving averages, or price action to gauge trend strength. |
| Market Timing | Aims to catch the beginning or end of a trend. | Often signals trends after they have already started or before they end. |
| Typical Users | Traders focused on precision in entry/exit points. | Traders who prefer to follow the trend and confirm before acting. |
Components of the TD Sequential Indicator
Every indicator had its own components which are used to determine the next live of the market. Similarly TD Sequential Indicator also consists of several components.
There are two major components:
- TD Setup
- TD Countdown
TD Setup
The TD Setup is the first phase of the TD Sequential Indicator. It was designed to identify potential trend in the chart. It identify potential by tracking specific price movements over a series of consecutive trading candles or bars. It is important to learn about the setup of the TD sequential indicator to highlight the reversal zones in the market.
Key Components of TD Setup
Sequence of 9 Bars:
The TD Setup consists of a sequence of 9 consecutive bars or candles.
These bars must meet specific criteria in their closing prices. And the closing prices should be relative to the prices of previous bars. But keep in mind that the previous prices should be taken from the valid TD Setup.
Criteria for Bullish TD Setup:
Each of the 9 bars must close higher than the close of the bar four periods earlier.
This sequence indicates that the market is in an upward trend.
Criteria for Bearish TD Setup:
Each of the 9 bars must close lower than the close of the bar four periods earlier.
This sequence indicates that the market is in a downward trend.
Setup Cancellation:
- If any bar within the sequence does not meet the criteria then the TD Setup is cancelled. And the sequence must start again. For example if the bar does not close higher or lower that the close four periods earlier then the setup is not counted.
Role of the Setup in Trading:
Trend Continuation: The TD Setup is used to see the continuation in the trend. It suggests the strength of the current trend.
Trend Exhaustion: Similarly the completion of a TD Setup can also be used to identify the exhaustion of the trend. It is more useful when the TD Setup is followed by a TD Countdown.
TD Setup
In the highlighted part i have shown a TD Setup for the STEEM/USDT pair.
As TD setup is observed when there is a consecutive sequence of the candles.
TD setup can be observed by the consecutive 9 candles.
And the closing of the consecutive candles is higher than the previous candles so it is the perfect ts setup and it presents that the market price will move forward.
And this TD setup proved to be very correct and the market moved in uptrend after that highlighted box.
It confirms that the selling pressure has exhausted.
The traders quite their sort trades and they can prepare themselves for the long trades.
TD Countdown
The TD Countdown is the second phase of the TD Sequential indicator. It follows the TD Setup. It helps traders to predict trend exhaustion and potential reversals in the market.
The TD Countdown begins after a TD Setup is completed. It involves a series of 13 bars or candles. They represent potential trend exhaustion.
TD Countdown is designed to point out when that trend might reverse.
Bullish TD Countdown:
- The closing of each bar should be lower than or equal to the low of two bars earlier.
Bearish TD Countdown:
- The closing of each bar must be higher than or equal to the high of two bars earlier.
- The sequence must reach 13 bars to complete. It indicates a potential reversal point.
Counting Rules:
If a bar does not meet the criteria the count is paused until another bar meets the condition.
The countdown does not need to be consecutive like the TD Setup. It simply counts valid bars until 13 is reached.
Importance of the 13th Bar:
The completion of the 13th bar suggests that the trend has exhausted. Traders often look for other confirming signals at this point to decide on entering or exiting positions.
TD Countdown
In this TD Countdown setup the blue counting is representing the TD Countdown after the valid TD setup.
These are showing the exhaustion of the previous trend.
After the TD Countdown the price broke the previous trend and followed a downtrend.
After the successful TD Countdown the traders quite their long trades and prepare themselves for the short trades.
It simply shows that the buying pressure has exhausted.
Question 2: The Psychology behind the TD Sequential
The TD Sequential Indicator is deeply rooted in market psychology. It works on the principle that markets are driven by the collective behaviour of traders.And this principle often results in trends that can become overextended due to sustained buying or selling pressure. The psychology behind this indicator is rooted in the idea that markets often follow patterns of human behaviour. It particularly follows fear and greed which drive price movements.
Psychological Foundation:
Trend Exhaustion: The TD Setup identifies when a trend may be nearing its end as traders become increasingly confident in the continuation of a trend, often leading to over-leveraged positions.
Market Sentiment: The TD Countdown reflects the diminishing momentum of the trend, capturing the point where traders start doubting the trend’s sustainability, leading to profit-taking or panic selling/buying.
This indicator plays on the psychological aspects of fear and greed, which are fundamental drivers in financial markets.
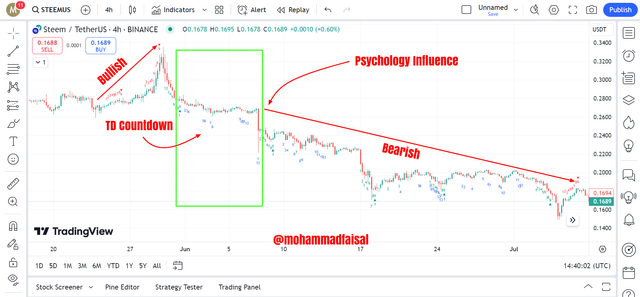
Psychological Impact on STEEM - TD Countdown
In the above example you can see how the psychological impact on the price of the coins.
We can see that the market was moving forward in the uptrend direction because of the TD Setup.
But when the TD Countdown happened completely after completing its total of 13 bars highlighted by the blue colour then the traders consider that the market now will move downward.
Here the traders' psychology affects the price of the steem usdt.
The traders star selling the coins and closing their long positions.
In a result the price moved downward.
You can see that the price really moved downward and it is the proof that the TD Countdown really exhausted the bullish pattern and set the price to the downtrend.
The traders consider that the buying pressure has also exhausted.
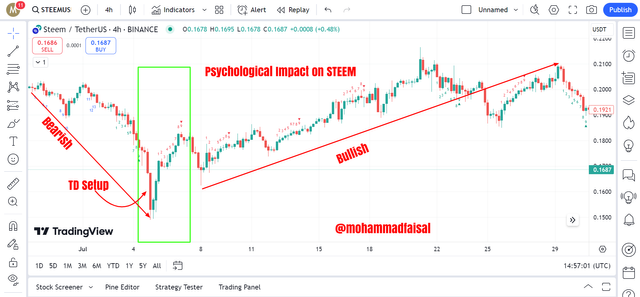
Psychological Impact on STEEM - TD Setup
Here you can see a historical signal of TD Setup.
It also affected the price.
It exhausted the previous trend of the price.
And psychologically It put the traders to consider that the selling pressure has decreased and now the price will move up.
And it has been proved that after the TD Setup there is a bullish trend which can be seen in the above chart.
So the psychology of the market participants affect the price and the next move of the market prices as well. You can relate it to any important news about crypto that can put the market to move in another direction.
Question 3: Explanation of the TD Setup
TD Setup: Detailed Conditions and Criteria
The TD Setup is the initial phase of the TD Sequential indicator, designed to identify the early stages of potential trend exhaustion or continuation. The setup consists of a series of bars or candles that must meet specific conditions to signal the completion of the TD Setup. Here’s a detailed breakdown of the conditions necessary for a TD Setup to be completed:
TD Setup Conditions
Bullish TD Setup:
Criteria: A Bullish TD Setup occurs when there are 9 consecutive bars where each bar closes higher than the close of the bar four periods earlier.
Sequence:
- Each bar in the setup must close higher than the close four bars earlier.
- The sequence must be uninterrupted, meaning if a bar fails to close higher than the close four bars earlier, the count is reset, and the setup sequence starts over.
Bearish TD Setup:
Criteria: A Bearish TD Setup occurs when there are 9 consecutive bars where each bar closes lower than the close of the bar four periods earlier.
Sequence:
- Each bar in the setup must close lower than the close four bars earlier.
- Similar to the Bullish setup, the sequence must be uninterrupted otherwise, the count resets.
Specific Criteria to Monitor
A. Closing Prices:
- The primary focus in the TD Setup is on the closing prices of the bars or candles. The close of each bar is compared to the close four periods earlier to determine whether the setup count continues or resets.
B. Consecutive Bars:
- The setup requires 9 consecutive bars that meet the criteria. If at any point a bar fails to close higher in a bullish setup or lower in a bearish setup than the close four bars earlier the sequence is interrupted. In this way the setup count must start from zero.
C. Market Conditions:
- The TD Setup is most effective in trending markets. Traders need to monitor the overall market conditions to ensure that the setup is not forming in a range bound or choppy market. Because this can lead to false signals.
Why These Criteria Are Crucial for Traders
A. Identifying Trend Strength:
- The TD Setup helps traders gauge the strength of the current trend. A completed Bullish or Bearish TD Setup indicates that the trend has maintained momentum for at least 9 candles. It suggest that the trend may continue or approach exhaustion.
B. Timing Entries and Exits:
- Traders use the completion of a TD Setup to time their entries and exits more effectively. For example the completion of a Bullish TD Setup might encourage traders to hold long positions. It suggests further upward movement.
C. Avoiding False Signals:
- By monitoring the specific criteria traders can avoid false signals. These false signals may arise from incomplete setups. This is particularly important in volatile markets. Because it volatile markets price movements can be unpredictable.
D. Foundation for TD Countdown:
- The TD Setup serves as the foundation for the TD Countdown. It tracks trend exhaustion and potential reversal points. Without a completed TD Setup the TD Countdown cannot begin. It is essential for traders to accurately identify and confirm the setup phase.
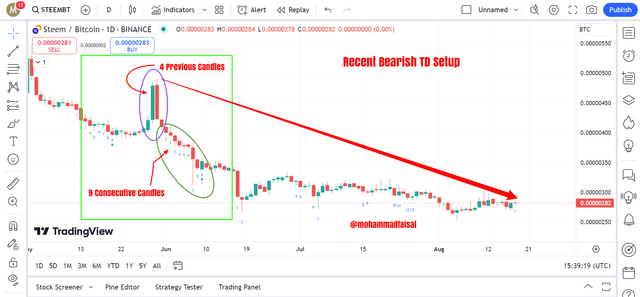
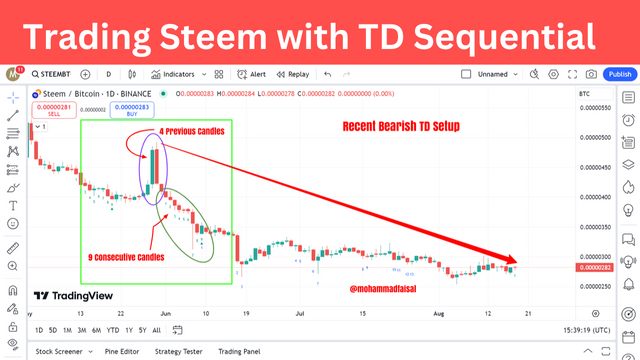
STEEM/BTC Recent TD Setup - Bearish TD Setup
On the daily STEEM/BTC chart i have identified a recent TD Setup.
This recent TD Setup is a Bearish TD Setup of STEEM/BTC pair.
We can see 9 consecutive bars of the daily closing which are closing below the 4 previous candles.
So the closing of the consecutive candles below than the previous candles suggests a bearish trend in the price of the STEEM/BTC pair.
This helped the traders to take decision for their next trades and holdings.
Seeing this setup the traders made a decision that the buying pressure has decreased.
This bearish TD Setup exhausted the previous trend and it represented the next bearish trend.
It saved the traders from any losses who took their decisions according to this bearish TD Setup.
Question 4: Using TD Countdown to Predict Reversal Points
As I have explained earlier TD Countdown which begins right after the TD Setup. But the condition is that the previous TD Setup should be valid. Here is the process for TD Countdown.
TD Countdown Process
Here is a step by step breakdown of the TD Countdown process:
Initiation of TD Countdown
Starting Condition: The TD Countdown begins only after a TD Setup has been completed. This means that there has already been a sequence of 9 consecutive bars that have met the criteria for either a Bullish or Bearish TD Setup.
No Immediate Reset: TD Countdown does not reset easily like the TD Setup. The countdown can consist of a much longer time frame.
Criteria for Counting Down
The TD Countdown consists of 13 bars. each meeting specific conditions. There are two types of TD Countdowns: Bullish and Bearish.
Bullish TD Countdown
Begins after a Bearish TD Setup has been completed.
Each bar in the Countdown must close lower than or equal to the low of the bar two periods earlier.
If a bar meets the counting condition, it is counted as part of the TD Countdown sequence. The sequence continues until the 13th bar is counted.
Bearish TD Countdown
Begins after a Bullish TD Setup has been completed.
Each bar in the Countdown must close higher than or equal to the high of the bar two periods earlier.
It is similar to the Bullish Countdown. Each qualifying bar or candle is counted. In this way the sequence continues until the 13th bar is counted.
Completion of the TD Countdown
Final Bar (13th Bar): The TD Countdown is complete when the 13th bar meets the counting condition. The completion of the Countdown often tells that the trend has exhausted. It tells that a reversal may occur.
Trend Reversal Signal: Once the 13th bar is reached this is a strong signal. IT tells that the current trend could be nearing its end.
For example:
In a Bullish TD Countdown the completion may indicate that the selling pressure is decreasing. And the price can start rising.
In a Bearish TD Countdown, the completion may suggest that buying pressure is ending. And the price can begin to fall.
Practical Considerations
Time Extension: The TD Countdown can extend over a longer period than the TD Setup. Because the criteria for TD Countdown is flexible. It allows the bars to meet the conditions over an extended time frame.
No Strict Sequence: Countdown does not require consecutive bars to meet the criteria. The Countdown progresses even if there are interruptions. It makes it more robust and accurate in capturing the exhaustion of a trend.
Usage in Trading: Traders often use the completion of the TD Countdown as a potential exit point. They also use it as an entry point into a position in the opposite direction.
Difference Between TD Setup and TD Countdown
Although both the TD Setup and TD Countdown are parts of the TD Sequential indicator. But they serve in different ways for the different purposes.
| Difference | TD Setup | TD Countdown |
|---|---|---|
| Purpose | The TD Setup is designed to identify the continuation of a trend. It tracks a sequence of 9 bars where each bar closes in the same direction relative to a bar four periods earlier. | The TD Countdown is focused on identifying trend exhaustion. It predicts reversals. It begins after a TD Setup and tracks 13 bars where each bar meets the specific conditions of closing lower or higher than a bar two periods earlier. |
| Applications | The TD Setup helps traders confirm the strength of an ongoing trend. It tells whether it will continue or not. It is a tool for trend identification rather than reversal prediction. | The TD Countdown is used to spot when a trend is likely to reverse. It offers traders potential exit points from a current trend or entry points for a new or opposite trend. |
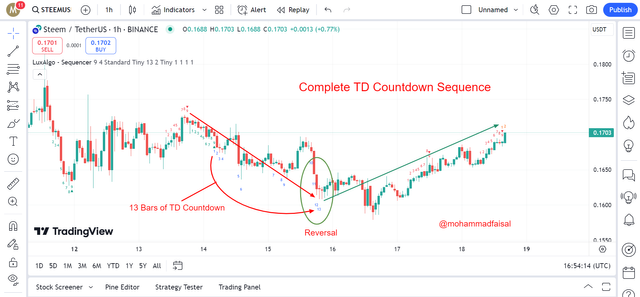
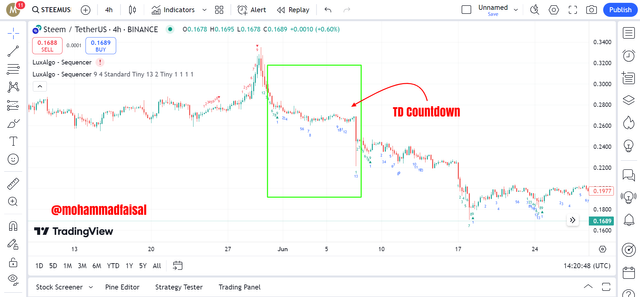
STEEM/USDT - Complete TD Countdown Sequence - Trend Reversal
In this STEEM/USDT chart under the 1 hour time frame I have observed a complete TD Countdown sequence which has happened recently.
The blue numbering is representing the 13 bars of TD Countdown setup.
This is a bullish TD Countdown.
And after the end of the complete TD Countdown Sequence a reversal happened.
You can see that the price went up in the 1 hour time frame.
The price rose from less than $0.16 to more than $0.17.
And currently at the end of the new TD Setup after the complete TD Countdown sequence a new TD Setup is being formed whose two candles has qualify the criteria for the TD Setup.
Question 5: TD Sequential-Based Trading Strategies with STEEM
The TD Sequential Indicator is a powerful tool. It is used to identify the potential trend reversals and the continuous trend. Here is a trading strategy for the STEEM/USDT pair using the TD Sequential Indicator. The optimization strategy for the maximum profit and minimum risk is also given.
TD Sequential Trading Strategy for STEEM/USDT
The strategy involves using both the TD Setup and TD Countdown phases to identify potential entry and exit points for trades.
Entry Points:
Long Entry: Enter a long position after a Bullish TD Setup. Bullish TD Setup occurs when 9 bars closing higher than previous 4 bars. And after a completed Bearish TD Countdown where 13 bars closing lower. This signals a potential upward reversal.
Short Entry: Enter a short position after a Bearish TD Setup. Bearish TD Setup happens when 9 bars closing lower than previous 4 bars and a completed Bullish TD Countdown where 13 bars closing higher. This signals a potential downward reversal.
Risk Management:
Here are some important risk management strategies which are very important to manage the risk of any trade.
- Stop Loss:
We must use stop losses for the safety of our trades and the funds.
For long trades always place the stop loss below the low of the 13th Countdown bar.
For short trades always place stop loss above the high of the 13th Countdown bar.
Use a trailing stop to lock in profits as the trade moves in your favour.
Take Profit:
In any trade it is very necessary to take profit except to fall prey to greed.
Take partial profits at key support and resistance levels.
Fully exit the trade when a new TD Setup appears in the opposite direction.
Optimization Tips:
TD Sequential indicator is one of the best indicator for the determination of the trading zones. But it can be optimized by using the following tricks.
Combine with Other Indicators: Use RSI, MACD and moving averages indicators to confirm signals. In this way we can align the trades in a more good way with the diverse indicators.
Multiple Time frames: Analyze the TD Sequential on different time frames. It gives better alignment and stronger signals.
Risk Management: Limit risk to 1-2% of your account per trade. Avoid over trading. Always enter when signals are strong and confirmed.
Continuous Improvement:
Continuous improvement is very important. And it helps us to find the lags and we can do better trades.
- Backtesting: Test the strategy on historical data and refine it based on past performance.
- Demo Trading: Practice in a demo account. After doing practice in the demo account join real trading by investing your real capital. With the help of the demo trading you will become confident and will learn potentials of the market using the TD Sequential indicator.
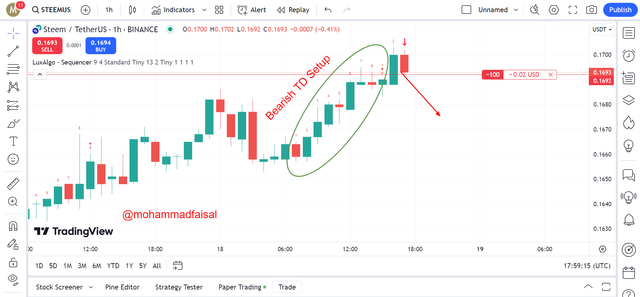
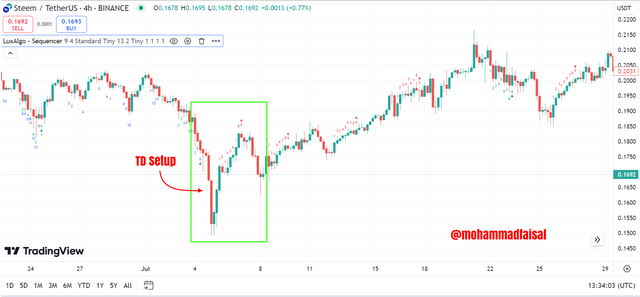
STEEM/USDT - Using the TD Sequential strategy for a trade setup
In the above chart of 1 hour time frame I have used the TD sequential technique to take entry in the trade.
As you can see that Bearish TD setup has formed after the completion of the 9 consecutive bars.
It was looking that it will follow the downtrend from that point.
The oval shape is representing the formation of the Bearish TD Setup.
And the previous trend will be exhausted.
In order to stay safe I made a small trade.

STEEM/USDT - Paper Trading
Seeing the downtrend determined by the Bearish TD Setup I decided to take an entry to the market. I took a short trade in the 1 hour time frame. I took short trade of 100 steems from the price of $0.1692. And now you can see in the above screenshot the running trade. My trade is going in the no profit no loss and the current market price is $0.1691 so we can expect that the trade will go in profit. So the prediction by the Bearish TD Setup is going well and the trade will soon move in profit.
So in this way we can use TD Sequential indicator to predict the market reversals and to determine the next move of the market.
Conclusion
The TD Setup phase is critical for traders using the TD Sequential Indicator. By focusing on the closing prices and ensuring that the 9 bar sequence is uninterrupted. The traders can gain insights into the strength of the current trend and make informed decisions about potential entries and exits. They can get information about the trend reversal. Monitoring these specific criteria is essential to use the full potential of the TD Sequential Indicator in various market conditions. The TD Countdown is a powerful tool for identifying when a trend may be losing momentum and is likely to reverse. It complements the TD Setup by providing a sequential method for tracking trend exhaustion.
I invite @suboohi, @shabbir86, @patjewell to join this learning contest.
Disclaimer: All the pictures used in the post have been taken from TradingView.com, Moreover all the data present in this post is just for the learning and it is not for the financial advice. Manage your trading risk at your own.
Thank you, friend!


I'm @steem.history, who is steem witness.
Thank you for witnessvoting for me.
please click it!
(Go to https://steemit.com/~witnesses and type fbslo at the bottom of the page)
The weight is reduced because of the lack of Voting Power. If you vote for me as a witness, you can get my little vote.
X Promotion: https://x.com/stylishtiger3/status/1825246695862456819
Trading is not an easy task for everyone. It is something which needs great care and attention. And there must be some trading tools and helping materials for the successful trading.
It is looking that from the TD sequential indicator we can easily spot the reversal in the market. You have explained in a good way the TD setup and TD Countdown and their respective features and techniques to keep in mind while using TD sequential indicator.
Thank you for your feedback
Helloo @mohammadfaisal
Nice to see your extensive post about the TD sequential indicator. I also made a post about this and I found it an interesting topic to explore.
And while exploring and writing this topic I learnt new things. You have also explained all the basic concepts in a good way while discussing the TD setup and TD Countdown.
The use of the charts and the markdown on the chart is also amazing. You have used a good approach to complete all the theory as well as practical tasks.
Thank you so much for your feedback.
Hi @mohammadfaisal you have presented TD sequential indicator with great explanation. All the charts are ful of information and the are representing the reversal in the market.
I have also done trading for many times and for many years including crypto and forex.
This indicaor is really very helpful.
Thank you for your valuable feedback.
TD setup is very important for buying and selling as we know you have presented it very well.All these places are very well presented and thank you for sharing. Best of luck to you
I agree with you dear that TD setup is very important in trading. It helps us a alot to spot the next reversal or exhaustion of the market.
Thanks for stopping by here and giving your valuable feedback.
Nowadays everyone is heading towards cryptocurrency trading. And they are finding some tools which can help them to find out the reversals in the market and to see the end of any trend.
And I think the TD sequential indicator is one of the best indicators for spotting the reversal and end of the trend.
I think I should also learn this indicator for my further trading life.
Thank you so much for your valuable feedback.
Good to see your blog after along time. The way you breaking down each section of TD Sequential indicator is really helpfull to understand how it can properlly applied and use on a price chart.
Especially the chart images that you shown for example are very clear to understand what they mean.
Yes I was unable to join blogging. Thank you for stopping by here and for your valuable feedback. Have a good day. How are you?
Sorry! Somehow I missed this post of yours.
Well, at least I got to read it now and it shared some light in the dark tunnel of "trading" I am in. (•ิ‿•ิ)
It's ok you are awesome
Awh! Thank you! ☕