SEC S20W02 || Trading Steem with Elliott Wave Theory
This is my homework post for Steemit Crypto Academy’s assignment on Steemit Engagement Challenge Season 20 Week 2, Trading Steem with Elliott Wave Theory.
Note :
- I am not a professional trader. What I have written in this article is theoretical, based on various sources I have read on the internet. By participating in assignments at Steemit Crypto Academy, I feel that I have gained a lot of theoretical knowledge in understanding the asset market (especially crypto) and also topics related to blockchain. Thank you for this opportunity.
- I performed this task on Windows 10 PC, Google Chrome.
A Brief History
When it comes to trading analytical tools, I'm always interested to know the historical background of the analytical tool being discussed, including Elliott Wave Theory. My internet searches from several sources led me to the following conclusions.
Elliott Wave Theory is one of the most popular technical analysis methods in the trading world. It gets its name from the person who introduced it, namely Ralph Nelson Elliott ((July 28, 1871 - January 15, 1948). Elliott was an American accountant. After retiring from his career in South America at the age of 60 due to health issues, Elliott, who was also a writer, began studying stock market data. Initially as a way to pass the time, in addition to utilizing his analytical background.
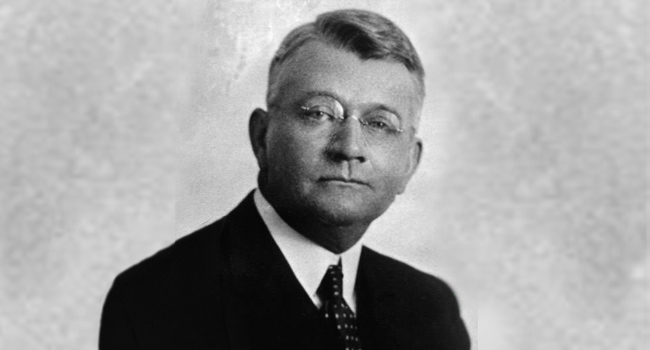
His study of stock market data, particularly historical data on stock prices in the Dow Jones (Dow Jones Industrial Average (DJIA)) led him to the conclusion that gave birth to the Elliott Wave Principle or commonly referred to as simply The Wave Principle. He observed that in the stock market, prices move in patterns, and not randomly. Elliott introduced his theory in 1938, after years of observing historical data, through his book entitled “The Wave Principle”. Through his observations of historical price data, he believed that market behavior reflects the collective psychology of investors and speculators, and that market behavior moves in repetitive patterns due to the psychological cycles inherent in human nature.
Task 1 - Describe the five impulsive waves of Elliott Theory Explain the characteristics of the five impulsive waves in Elliott Wave Theory and the key criteria that differentiate impulsive waves from corrective waves . Use the STEEM/USDT trading pair as an example to illustrate your explanation.
The Characteristics of the Five Impulsive Waves in the Elliott Wave Theory
In Elliott Wave Theory, there are 5 impulsive waves that are part of the price movement in the main trend. The characteristics of the five waves are:
- Wave 1: Impulsive, The Start Of A New Trend
This wave is almost undetectable, as it occurs at the end of a trend. Only a small percentage of traders are active in this wave, hence the low participation rate. Only the few traders who are able to spot signs of a trend change participate in this initial wave. - Wave 2: Corrective
This wave brings a slight correction to the first wave as traders start to take the first step. Prices move slightly but will not reach or surpass the top or highest level previously reached. - Wave 3: Impulsive
This wave witnesses the most power in the 5 impulsive waves. This is due to the greater participation in the market as the market becomes more aware that a new trend is forming. - Wave 4: Second Corrective
Another correction occurs, but usually the correction in this wave is lower than the correction in wave 2. - Wave 5: The Last Wave in the Impulsive Move
The fifth wave is the last wave of the impulsive move, and the price moves beyond the levels it achieved in wave 3 (higher in a bullish trend and lower in a bearish trend).
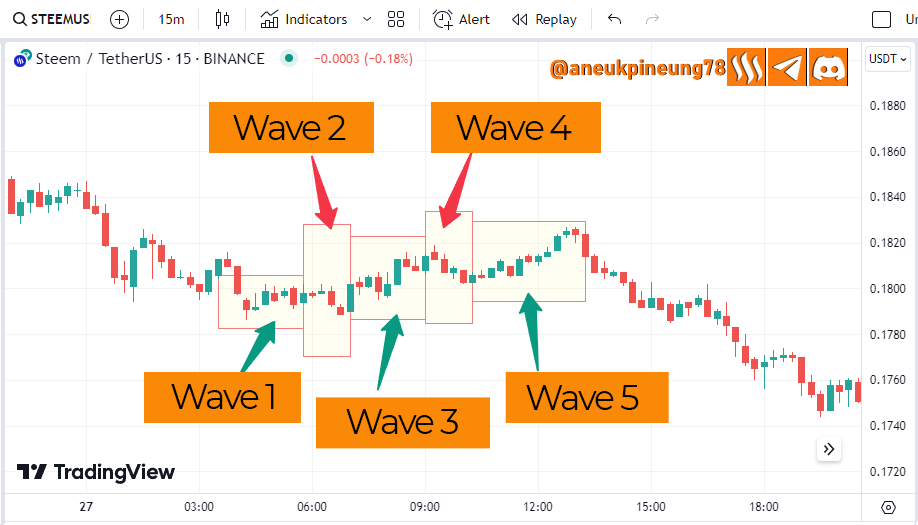
Let's take a look at the following historical price chart of STEEMUSDT in 15-minute trades on the Binance spot market as seen on TradingView which occurred on Tuesday, August 27th. This screenshot shows impulsive waves in a bullish trend.
The Key Criteria That Differentiate Impulsive Waves From Corrective Waves
Some of the key criteria that differentiate these two sets of waves are:
- Corrective Waves move in the opposite direction to the main trend. While Impulsive Waves move in the same direction as the main trend.
- Corrective Waves tend to be shorter and weaker compared to impulsive waves and make only minor corrections in the direction of the main trend.
- Volume in Impulsive Waves is higher and momentum is stronger when compared to Corrective Waves, this is due to higher participation in favor of the main trend direction than against the main trend direction.
- Impulsive Waves tend to have a longer duration compared to Corrective Waves, especially Wave 3 which in theory is usually the longest in duration, although this is not always the case. In the example above we see that Wave 5 is the longest Impulsive Wave in the bullish Impulsive Move.

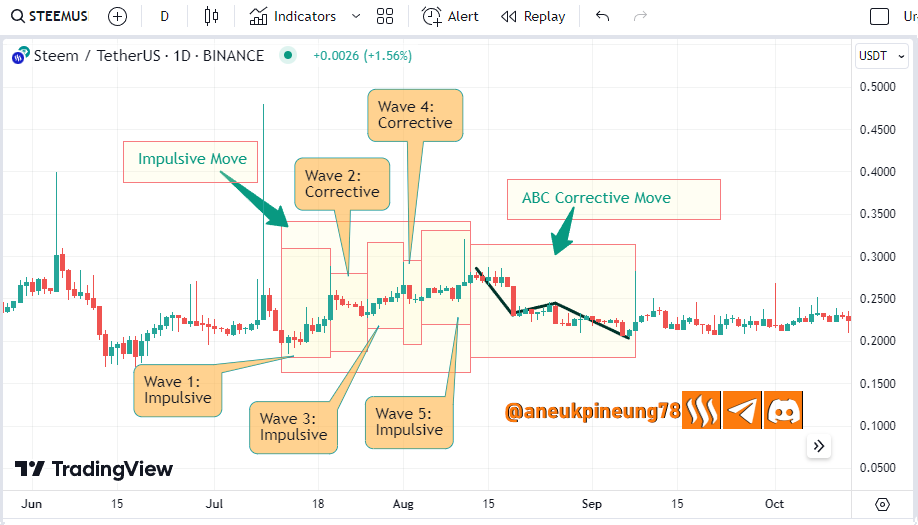
Task 2 - Identify impulsive and corrective waves on a Steem chart. Using a historical chart of the Steem price, identify impulsive and corrective waves over a given period. Explain why certain waves are impulsive and others corrective. For this analysis, use a daily or weekly time frame.
To identify impulsive and corrective waves in a chart, we must first find the impulsive moves i.e. the main trend direction that contains the waves. Every impulsive move (whether bearish or bullish) according to Elliott Wave Theory, always consists of 5 waves, where waves 1, 3, and 5 are impulsive waves (moving in the direction of the main trend), while waves 2 and 4 are corrective waves that move in the opposite direction from the main trend direction. This means that in a bullish trend, waves 1, 3, and 5 will move upwards, while waves 2 and 4 will try to move downwards (or at least sideways), and vice versa.
Let's look at the STEEMUSDT historical price chart on 1-Day trading between July 12, 2022 and August 12, 2022 on the Binance Spot market as shown in the following TradingView.
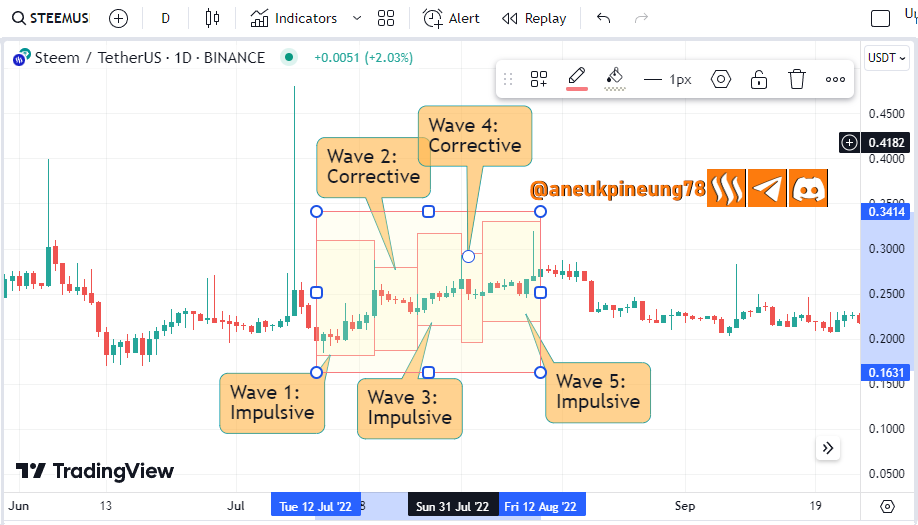
In the image above, it can be seen that the Impulsive Move (main trend direction) is bullish. Waves 1, 3, and 5 move in the direction of the main trend (bullish) and are referred to as Impulsive Waves. While waves 2 and 4 as Correction Waves move in the opposite direction or sideways to the main trend direction (Impulsive Move).
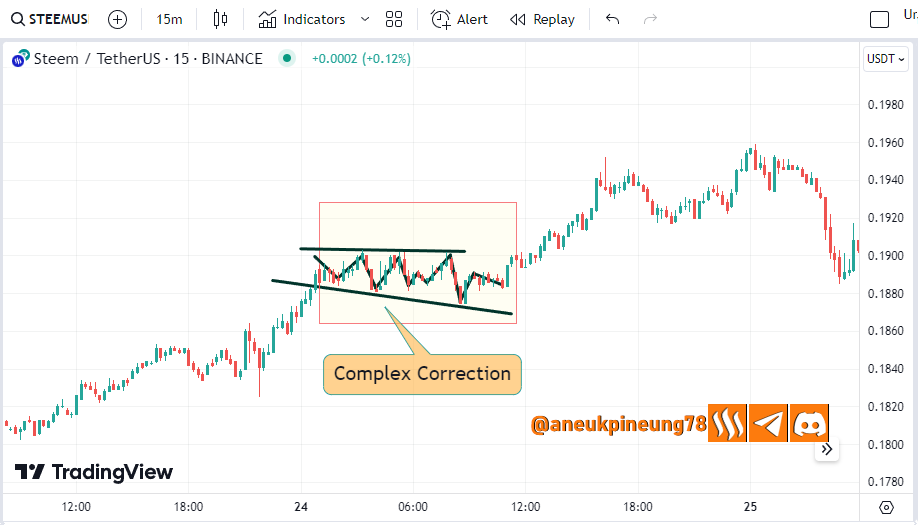
Task 3 - Explain the alternation rule in corrective waves. Discuss how the alternation rule applies to corrective waves in Elliott Theory. How might this rule influence a trading strategy for the Steem token ? Provide an example of a complex correction versus a simple correction using a Steem chart.
Alternation Rule In Corrective Waves
The Alternation Rule in Corrective Waves in Elliott Wave Theory states that two Corrective Waves in an Impulsive Move will not have the same movement pattern and characteristics. This means that the second Corrective Wave (the fourth wave in an impulsive move or the main direction of the trend), will not have the same characteristics as the first Corrective Wave (wave two).
How The Alternation Rule Applies To Corrective Waves in Elliott Wave Theory
The Alternation Rule in Corrective Waves in Elliott Wave Theory states that two Corrective Waves in an Impulsive Move will not have the same movement pattern and characteristics. That is, the second Corrective Wave (the fourth wave in the impulsive move or the main direction of the trend), will not have the same characteristics as the first Corrective Wave (wave two). The characteristics that explain How The Alternation Rule Applies To Corrective Waves in Elliott Wave Theory referred to above are:
- Duration. If the first Corrective Wave (wave two) had a short duration, then it can be expected that the second Corrective Wave (wave four) will have a slightly longer duration, and vice versa.
- Depth. The second Corrective Wave tends to have a lower depth than the first Corrective Wave. The first Corrective Wave (wave two) can correct above 50% of the first wave, while the second Corrective Wave (wave four) usually only corrects up to 40%.
- Correction Pattern. If the first Corrective Wave is complex (e.g. flat pattern) then the second Corrective Wave will tend to be simpler e.g. zigzag pattern.
- Complexity. If the first Corrective Wave (wave two) is a flat and simple correction, then wave four (Corrective Wave two) will be sharp and complex.
How The Alternation Rule Influence A Trading Strategy For The Steem Token
In relation to STEEM Token trading, the Alternation Rule in the first Corrective Wave (second wave in an impulsive move or main trend) can be utilized by STEEM token traders to anticipate the characteristics of the second Corrective Wave (fourth wave). This means that if the second wave (first Corrective Wave) is short with a complex pattern, STEEM token traders can hope and prepare with the best strategy to face the second Corrective Wave (fourth wave) which will be longer in duration and simple in pattern.
Example Of A Complex Correction Versus A Simple Correction Using A Steem Chart
Based on the information I gathered on the internet, I have created a comparison table between Simple and Complex Corrections as follows:
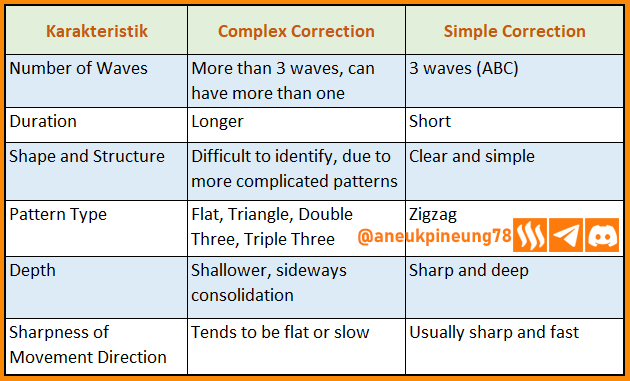
Based on the information from the comparison table between Simple and Complex Corrections as seen above, here is an example of both types of corrections based on the STEEM historical price data chart on the Binance Spot 15-minutes market as seen on TradingView:
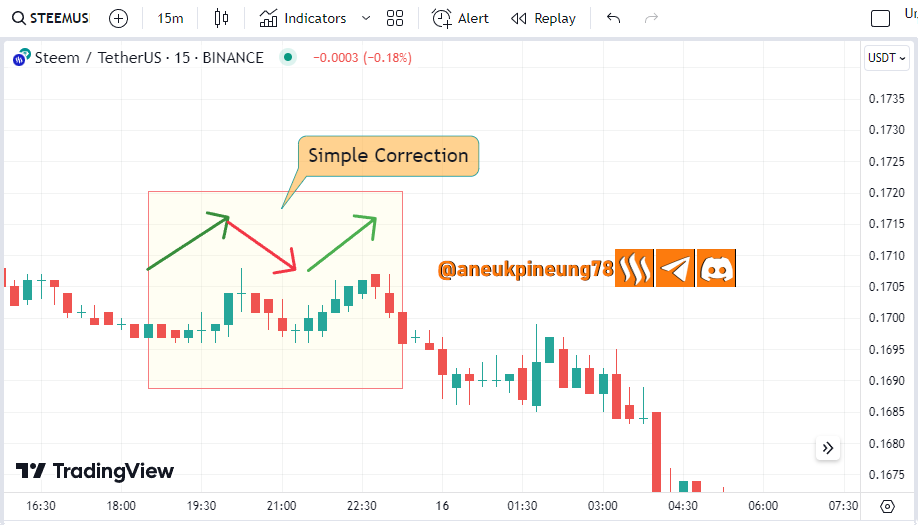
- Simple Correction example
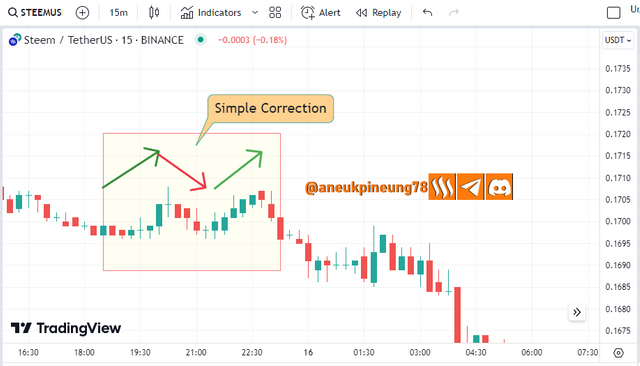
Simple Correction on STEEMUSDT historical price chart on Saturday 15 September 2024 between 11:30 to 16:15 UTC. - Complex Correction example
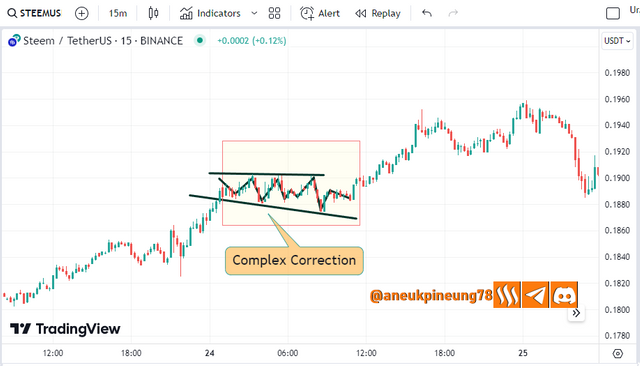
Complex Correction on STEEMUSDT historical price chart between Friday 23 August 2024 18:00 to Saturday 24 August 2024 04:30 UTC.
Task 4 - Draw a trading scenario for Steem based on Elliott waves. Using a technical analysis platform like TradingView , plot a trading scenario for Steem based on a complete formation of the impulsive waves 1-2-3-4-5 , followed by an ABC correction. What would be your strategy for entering and exiting trades during each wave? Include Fibonacci levels for your entry/exit points.
A Complete Formation of the Impulsive Waves 1-2-3-4-5 , Followed By An ABC Correction on STEEM Historical Price Chart
I have observed the STEEM (STEEMUSDT pair) historical price chart on 1-day trades that appeared between Tuesday, July 12, 2022 and Thursday, September 8, 2022 on the Binance spot market as shown in TradingView. During this period, there was a bullish-type Impulsive Move between Tuesday, July 12, 2022 and Friday, August 12, 2022, followed by an ABC-type Correction Move until Thursday, September 8, 2022 as shown in the image below.
Strategy For Entering And Exiting Trades During Each Wave With The Assistance Of Fibonacci Levels
To the STEEMUSDT historical price chart image, I included Fibonacci Retracement to help me see the opportunities that could have been taken when this historical chart occurred. Here is the picture:
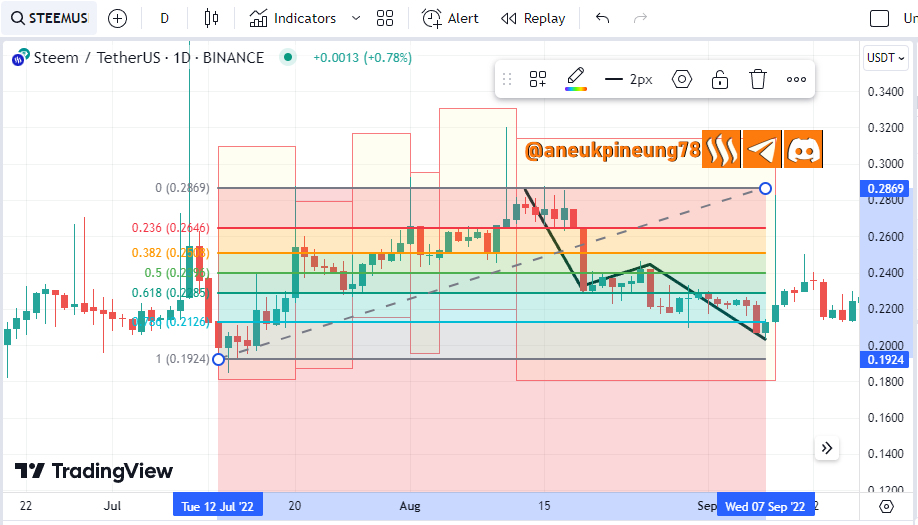
Entry and Exit Strategy in Impulsive Move Phase
It's not easy to realize that a new trend (impulsive move) is starting to form. So in my case, if I am trading, I may very well miss this, because the first signs of an impulsive move are hard to detect. I might realize that the market might be forming an Impulsive Move, after a few bars. My belief that an impulsive move (in this case bullish) is forming will be stronger after witnessing wave three forming (the second impulsive after the first corrective in wave 2). I would most likely enter the market at this point, at bar 2 or 3. And when the correction occurs again (wave four), I can expect it to be more modest and of shorter duration than the correction in wave 2. Since wave 2 corrected through 6 bars, I can expect to be able to capitalize on the opportunity and buy again at bar 3 or 4 in wave 4. Realizing that this will be the last wave of this bullish Impulsive Move, I will wait for the next correction signal to exit the market.
Entry and Exit Strategy in Corrective Move Phase
An Impulsive Move will be followed by a Corrective Move. In this case, the Impulsive Move (5 Impulsive Waves) is bullish followed by a Corrective Move (3 Corrective Waves) of ABC type. Traders can also utilize the Corrective Move to take profits. After I decide to exit the market at the initial signal of the end of the fifth wave in the Impulsive Move with the appearance of a Corrective Move signal, I will wait for the market to form a Corrective Move to a certain point and buy when the market shows a correction signal in the Corrective Move, and sell again when the signal shows a change in direction again. The ABC Correction type is the easiest to observe.
Function of Fibonacci Levels as Signal Confimator
Although Impulsive Move and Corrective Move can be observed with the naked eye, utilizing other analytical tools such as Fibonacci Levels to get confirmation of signals is a good and recommended decision. The image above shows how Fibonacci Levels identify potential support and resistance levels on the STEEMUSDT price chart. This actually helps to predict how far a wave will go so that traders can make the most of it to benefit their trading.
Task 5 - Analyze the current trend of the Steem market using Elliott waves. Analyze the current Steem market trend using Elliott Wave Theory. Where do you think the Steem token is in its wave cycle (impulsive or corrective)? What are the next possible moves? Support your analysis with technical indicators such as RSI or moving averages.
Here is the latest historical price chart of STEEMUSDT in 15-minute trades on the Binance spot market as seen on TradingView, which I observed on Wednesday, September 18, 2024.
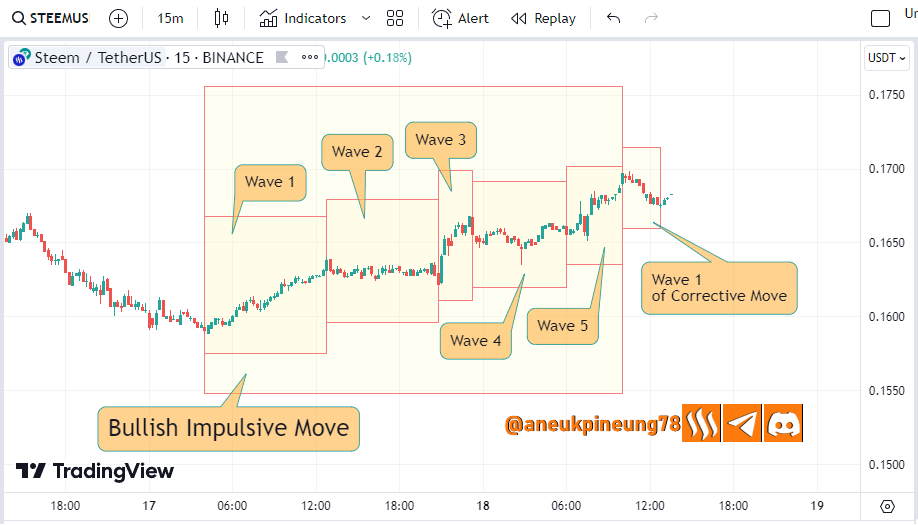
The image shows that between Tuesday, September 17, 2024 at 18:00 UTC and Wednesday, September 18, 2024 at 03:00 UTC there was a bullish Impulsive Move in the STEEMUSDT price. And since then the STEEMUSDT market has entered the Corrective Move phase. In the picture we see that the market has completed the first wave of the Corrective Move and is forming the second wave. This is a good time to position.
Thanks
Thanks @crypto-academy for the lesson.
Pictures Sources
- The editorial picture was created by me.
- Unless otherwise stated, all another pictures were screenshoots and were edited with Adobe Photoshop 2021.
Sources and Reading Suggestion
- https://en.wikipedia.org/wiki/Ralph_Nelson_Elliott
- https://en.wikipedia.org/wiki/Elliott_wave_principle
- https://elliottwave-forecast.com/elliott-wave-theory/
- https://www.investopedia.com/terms/e/elliottwavetheory.asp
- https://www.investopedia.com/articles/technical/111401.asp
- https://rhbtradesmart.co.id/article/dari-1930-sampai-sekarang-ini-dia-teori-elliott-wave-dan-cara-membaca-pergerakannya/
- https://corporatefinanceinstitute.com/resources/career-map/sell-side/capital-markets/elliott-wave-theory/
- https://www.wallstreetmojo.com/elliott-wave-theory/
- https://id.tradingview.com/education/elliottwaves/
- https://hdfcsky.com/learn/chapters/elliott-wave-theory
- https://www.hsb.co.id/glosarium/e/elliot-wave
- https://www.investopedia.com/terms/i/impulsewave.asp
- https://dailypriceaction.com/blog/impulsive-corrective-waves/
- https://medium.com/coinmonks/elliot-wave-theorem-845c61b44bdf
- https://www.topratedforexbrokers.com/education-and-guides/simple-corrections/
- https://bata4u.com/EW/combinations.html
- https://www.investopedia.com/articles/active-trading/091615/how-set-fibonacci-retracement-levels.asp


https://x.com/aneukpineung78/status/1836602092594827601
@aneukpineung78 I appreciate how you've explained the key points so clearly. Its really important to highlight the role of digital tools in todays world especially in education. your thoughts on the topic are well organized and insightful. I also liked how you tied the benefits of online learning with real-world examples making it easy to relate to. You rock! I am so impresed by your entry. Keep up the good work and good luck with the contest
I hope you enjoyed the show, if there's anything you can suggest or correct, please do, my bro @hamzayousafzai.
i think your one is perfect .. i am worried about my one
Have you started writing it? I am looking forward to reading yours.
Which indicator you used?
There's no indicator, my friend. It's called Elliott Wave Theory, with the theory you'll see the method, and you'll understand how to see the chart based on the method that was based on the theory. I know you understand. Or maybe it is me doing mistake. I guess I'll see your entry soon. Have you started it, @stream4u?
You may right I just got confused and wasted a day.
I may be right means I might be wrong. 😃😃😃
I do hope you can proceed with full confidence, my bro!