A price analysis of Ethereum for the week — a pair of ETH / USD has broken major resistance
ETH / USD broke the key barrier, which increased growth above $ 350.
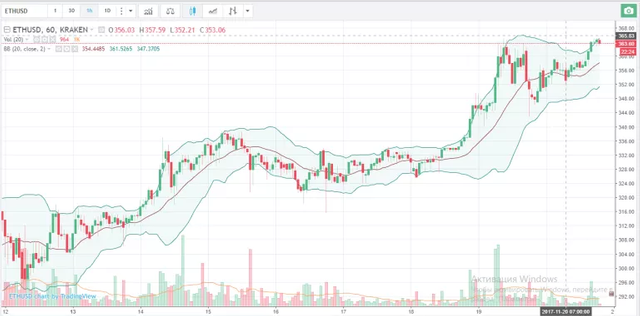
— ETH moved up above resistance at $320 and now at 363.
— there is a bullish trend-line support at $337 4-tion chart ETH / USD;
— the pair is in an uptrend and likely to go above $370.
For the cost of the ETH last week was pretty good, she was strong resistance at $320. The upward movement was steady, the price has reached $348. The above breakthrough has opened doors for growth of over $365.
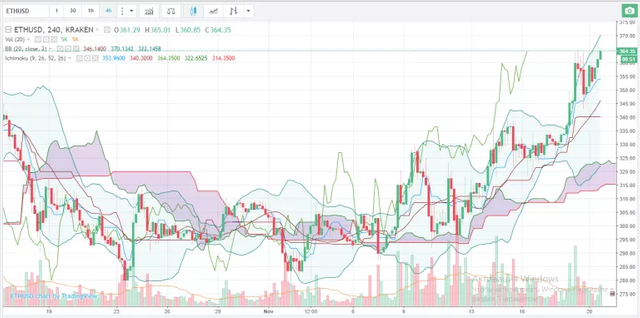
Today the price is over $ 360, and, it seems, will soon increase the gain. Initial support of about 23.6% of Fibonacci from $ 319.93 to $ 363. But the most important support is about $ 337. On the 4th ETH / USD chart the main line of the bullish trend is formed with support at $ 337. 38.2% of Fibonacci from $ 319.93 to $ 363 is also near support. Therefore, a correction may result in prices of about $ 337-345.
The price can break a maximum of 365, above this - $. 370 with the fall, the price may drop to $ 337 and $ 328, this can be considered as an opportunity for purchases, while the price is higher than $ 320.
4 th MACD - in the bull zone.
The 4th RSI is approaching level 70.
Support - $ 345
Resistance - $ 370
Nice Post