Bitcoin chart analysis!
Hello Steemians and my followers,
More than 4 months passed since my last post. However today decided to make an update for Bitcoin (thanks to my friends comment I read)!
Let's get back to Bitcoins chart analysis:)
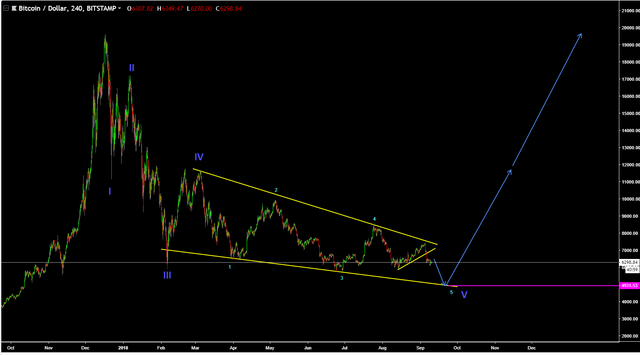
BTC did what I was expecting when posted last time, however it spent longer in consolidation and dropped lower (my last chart):
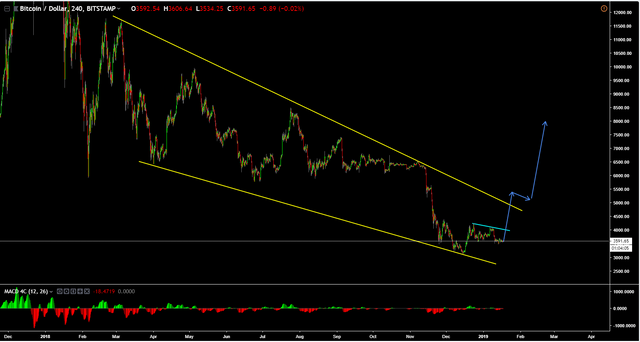
Currently BTC looks like forming a bullish correction for upside, so let's see of it gains some momentum and breaks light blue trend line:
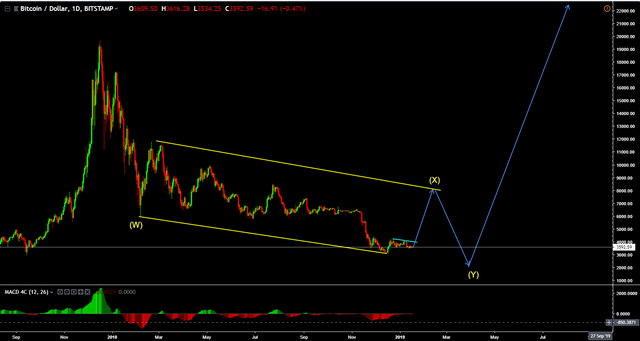
Looking forward I still see 2 possible scenarios:
- total reversal upside for new historic high;
- longer term consolidation:
IF YOU LIKE THIS, PLEASE UPVOTE AND RESTEEM THIS POST. THANK YOU!
Note: This is not a financial advise or trade call, it's only my personal opinion and arrows in the charts shows just an indication of direction, not the specific points or targets!
Your crypto_analyst
@andriustovis
was wondering where you went. even though nobody wanted to hear about the bear, you were accurate in predicting it. keep the analysis coming :).
Thanks!
Welcome back.Good to see you are around.
Thanks!
It is always hard to know which direction but the market remain in a bearish trend.
Posted using Partiko Android