Bitcoin Rally Gets Rekt [Bitcoin Price Update 2/22/2018]

Bitcoin's attempt to continue its rally was rejected today, and BTCUSD sold down under key support. The daily 12 EMA is valued back below the 26 EMA in a rejection of yesterday's bullish moving average crossover. Lower prices are now likely.
4-Hour Chart
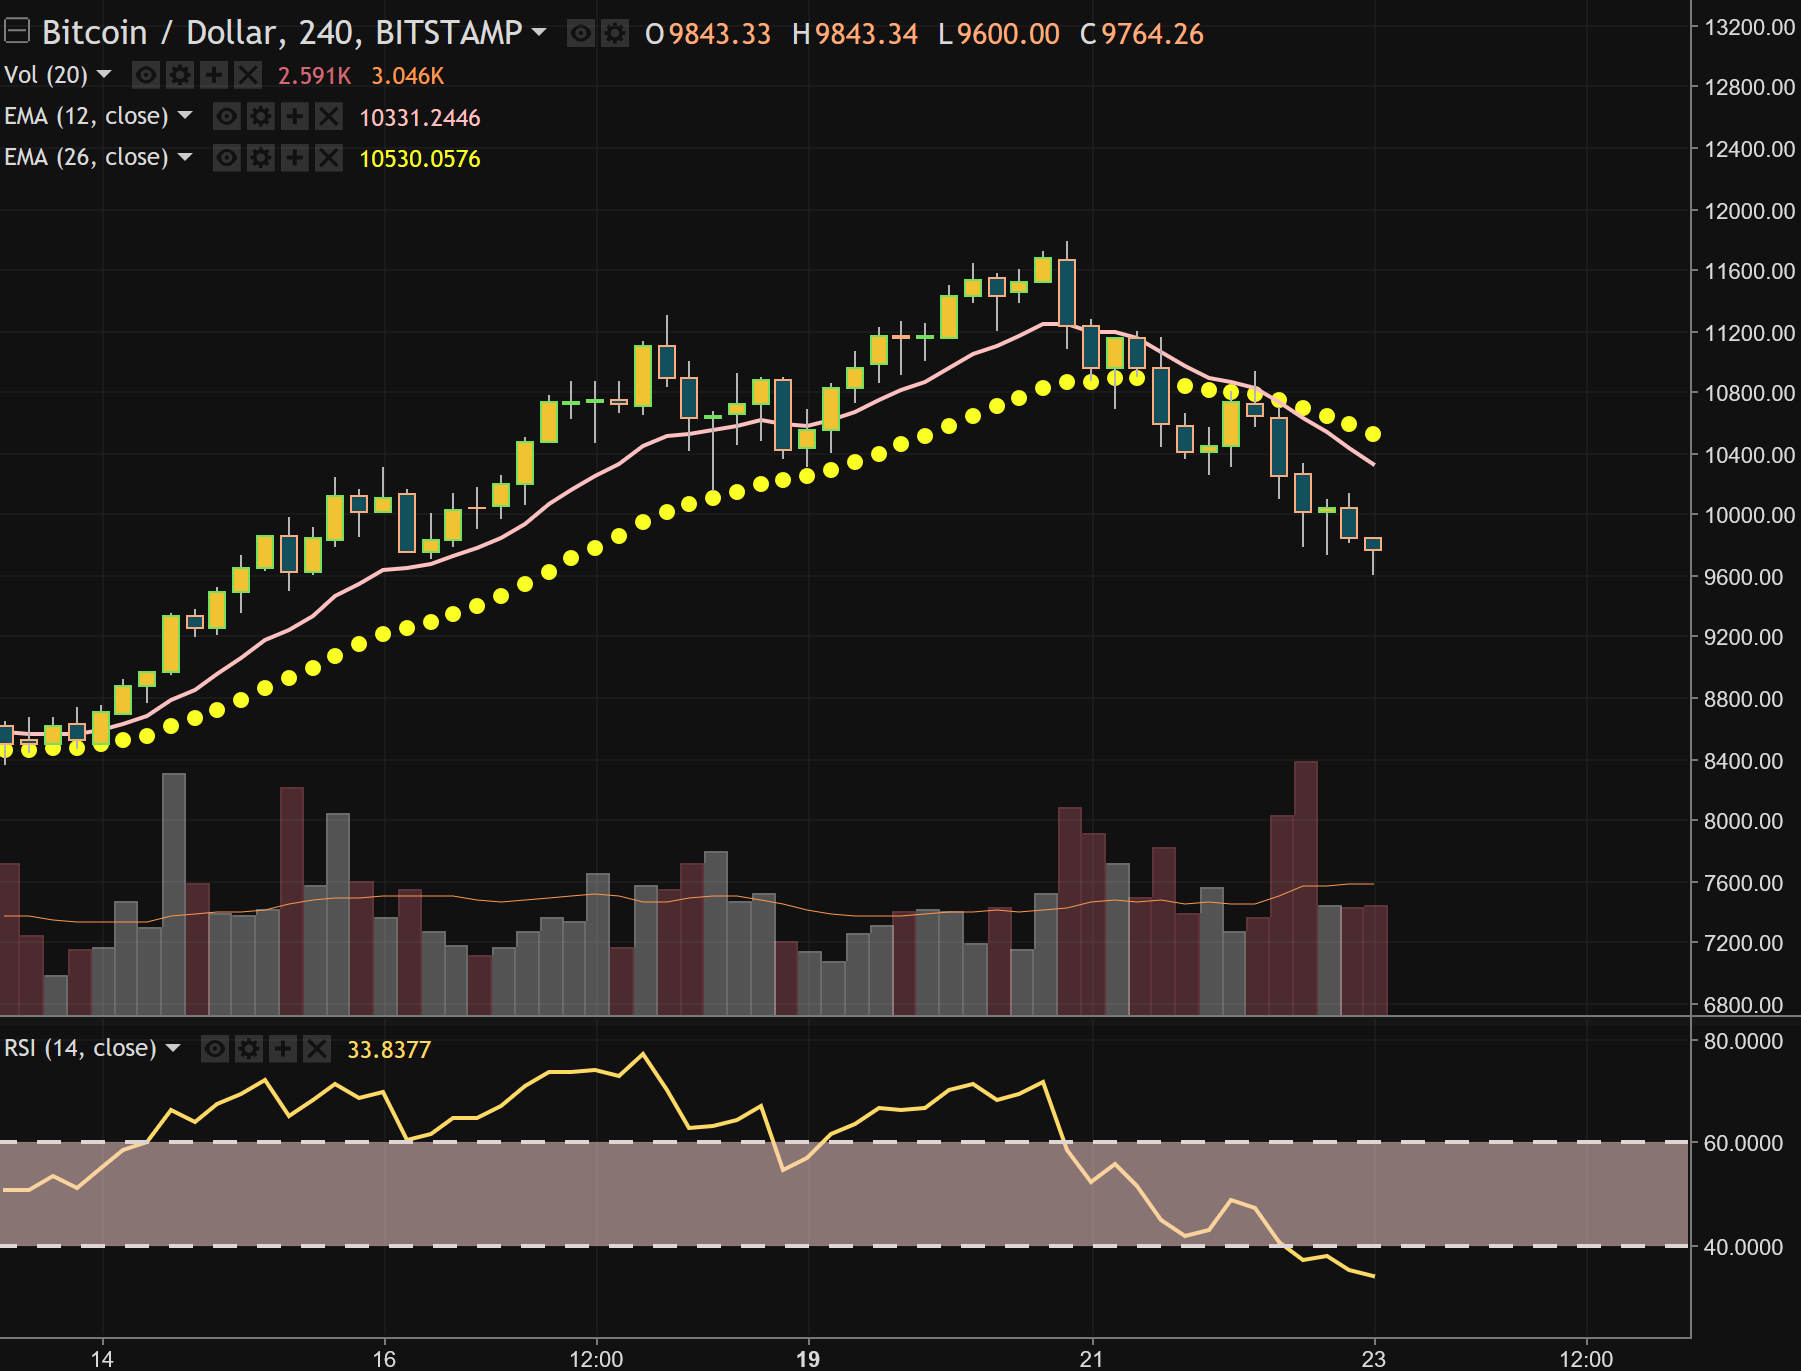
12 EMA: $10,330
26 EMA: $10,530
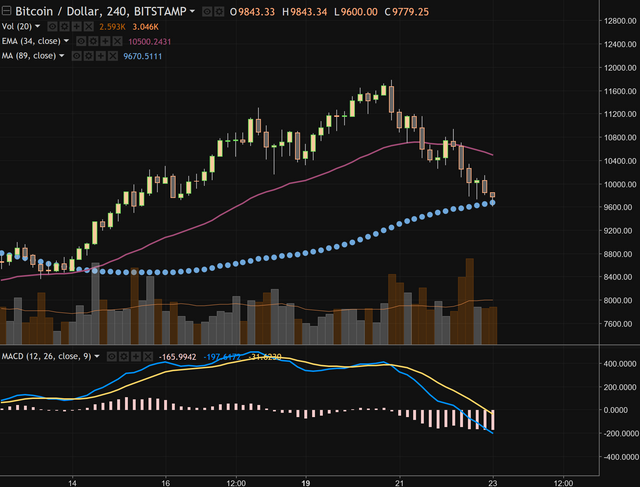
34 EMA: $10,500
89 SMA: $9,670
The 4-hour chart is bearish, though the 89 SMA has so far supported the price. The 34 EMA also trades above the 89 SMA, so according to this double moving average pair, there's still the remnant of an uptrend. A break below $9,670 will have Bitcoin trading below all of the moving averages this column follows.
Daily Chart
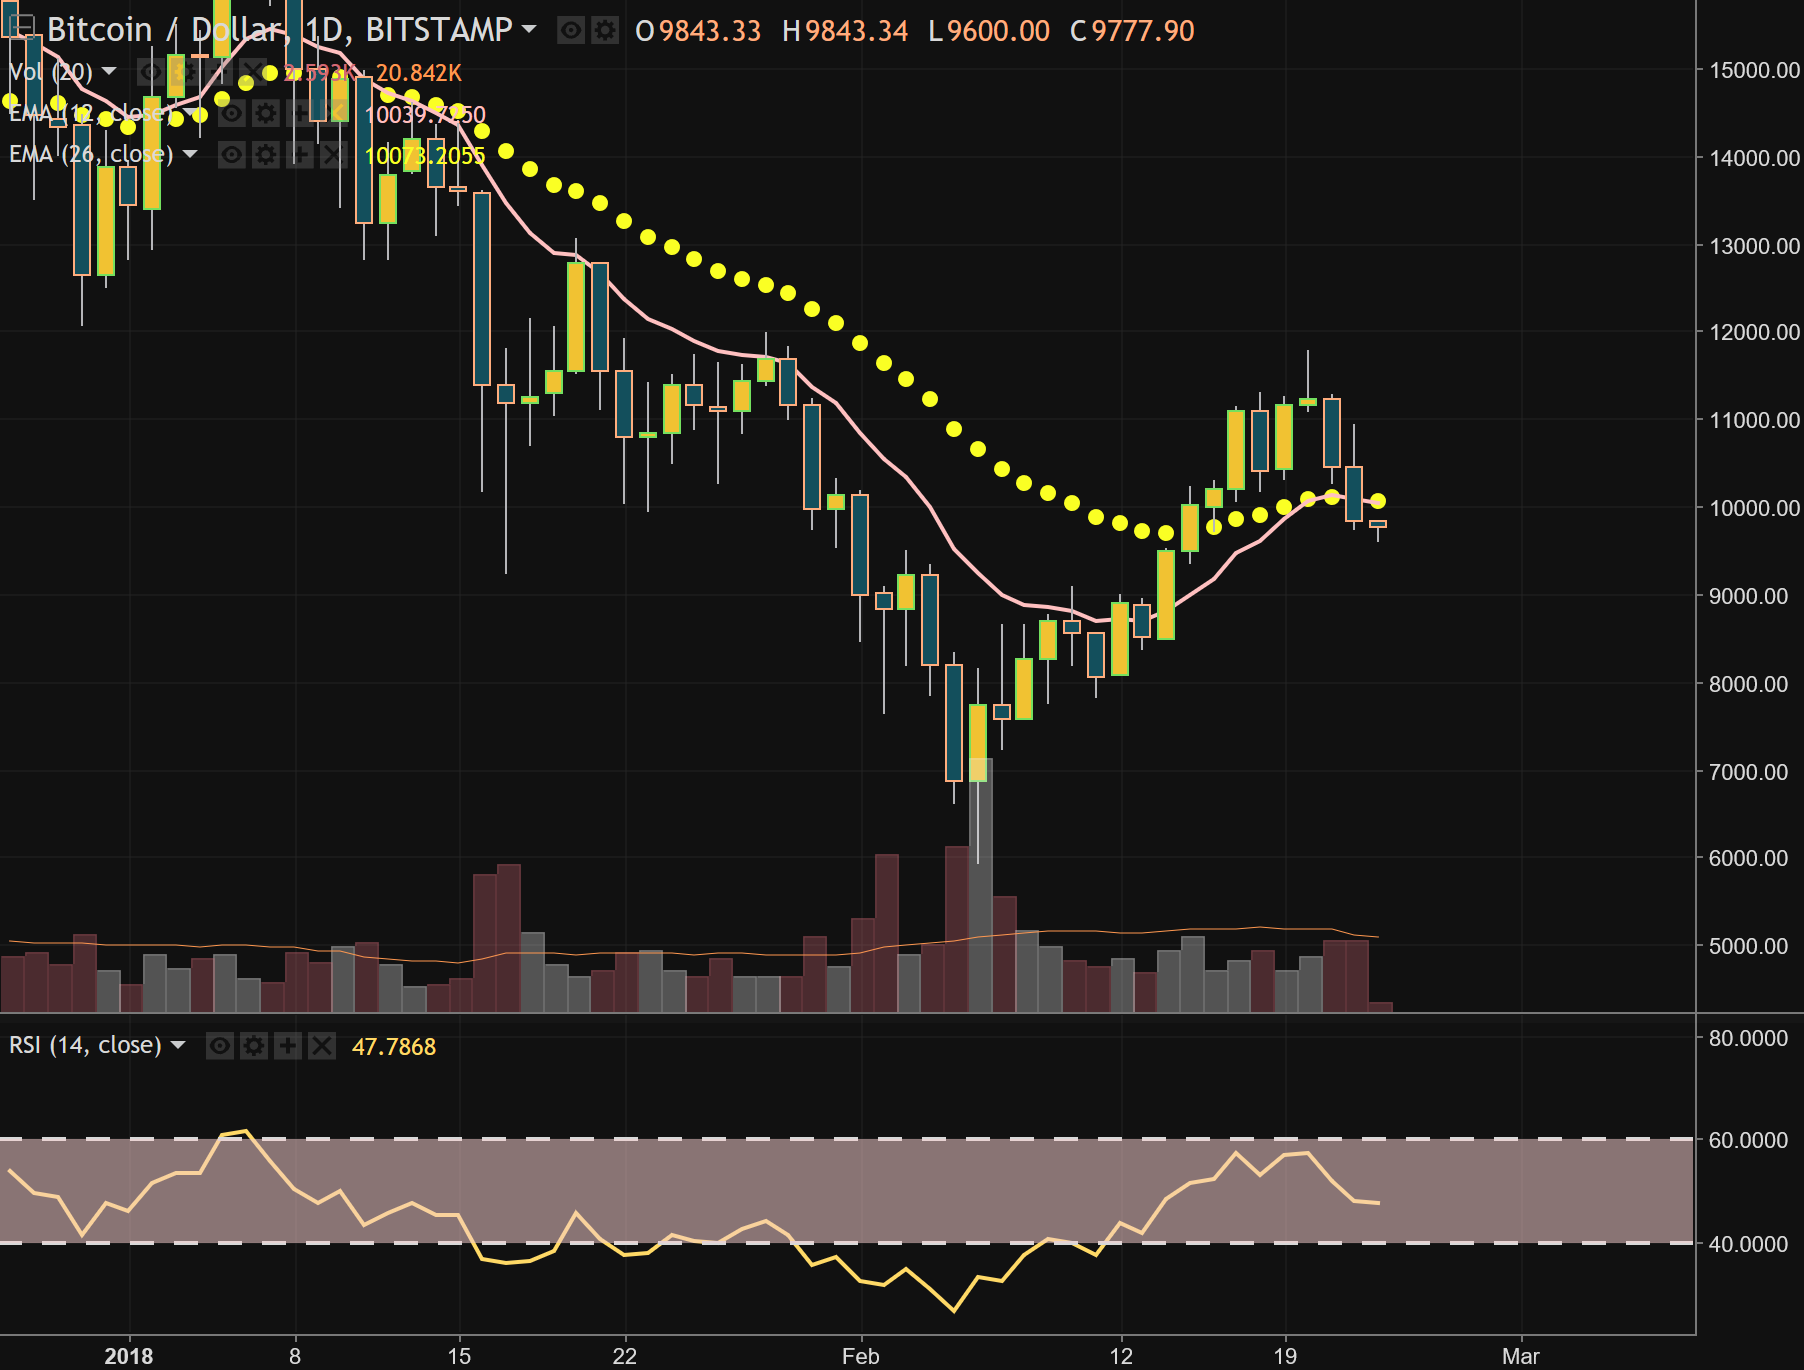
12 EMA: $10,040
26 EMA: $10,075
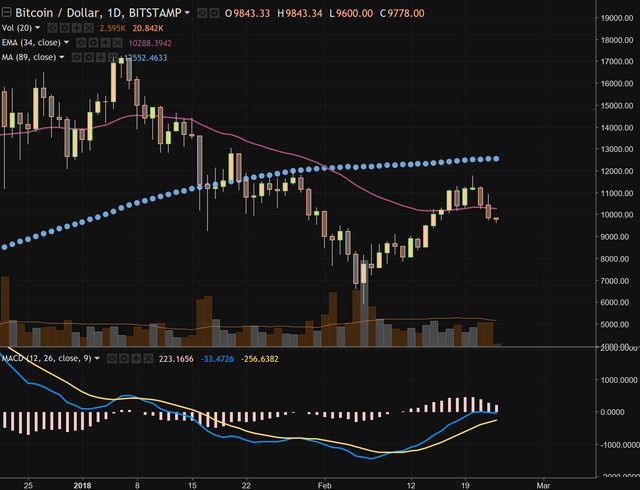
34 EMA: $10,290
89 SMA: $12,550
The daily chart of Bitcoin has returned to bearishness. The Bitcoin price now trades below all of the moving averages followed here: the 12 EMA, 26 EMA, 34 EMA, and 89 SMA. In both double moving average systems, the fast line is trading below the slow line. This is very bearish, and lower prices are expected.
DISCLAIMER
This post is for information and illustrative purposes only. It is not, and should not be regarded as “investment advice” or as a “recommendation” regarding a course of action.
SUPPORT
Bitcoin: 19498NLGwLbzN7yKrNbYqc4wuwZPkTGMVD
Ethereum: 0x76F2D78c81C6C97473DaF2aa3219F78Ce8C5A92f
Litecoin: LNhKXYTC5t2ZxcKYfo3pMzk8QsjZXsEbgT
CONTACT
twitter: sjanderson144
instagram: sjanderson144