Bitcoin(BTC) Chart Trading Study in 13th July.
Hi~^^
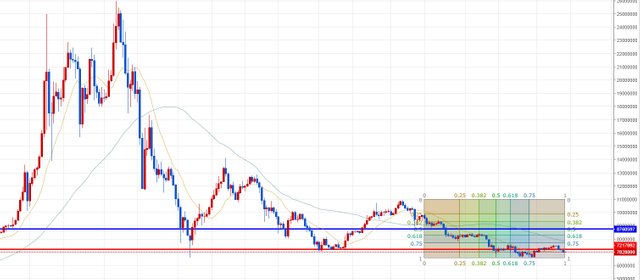
- 1day candle chart
Today I will describe the viewpoint on 1day candle.
Currently, It support the triple bottom. It is often called a triple bottom.
There was no rebound in the past of the peak of the May.
At some point, this will rebound.
but, it can be a supportive point, and it can rebound after breaking away from support.
And it can think of it as the rebound interval from the peak of May to the center width of the box.
Let's hope. Individual investors are the greatest advantage of time.
At present, the target price is $ 8,760.
** Disclaimer: This post is a personal idea, not an investment idea. The transaction is a small transaction, so please enjoy it. It is your responsibility to invest, and you should be aware of subjective judgments and technical analysis to make investments.
I like you content! It is great!