Bitcoin(BTC), Chart Trading Study in 9th July.
- I am analysis only downward trends.
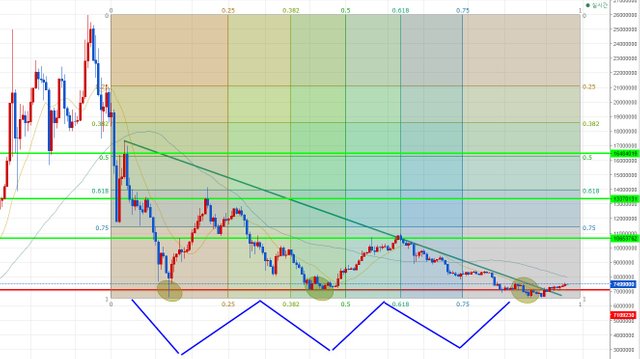
- 1day candle chart
Yesterday and the chart are not volatile. Currently, it is a triple bottom. It is a marked with an ellipse.
It reset the first peak to $10,650 from the mid-term viewpoint. Yet, it didn't come up to the center of the highest point.
I need more time to get up. I believe.
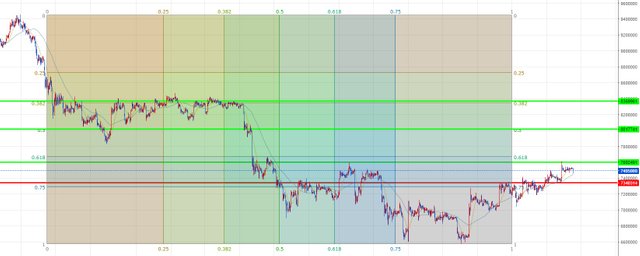
- 1hour candle chart
It has encountered a resistance point of $ 7,600. Adjustment is expected. However, it is still previous declining.
Never, price volatility doesn't rise at once. It always has an adjustable of resistance zone.
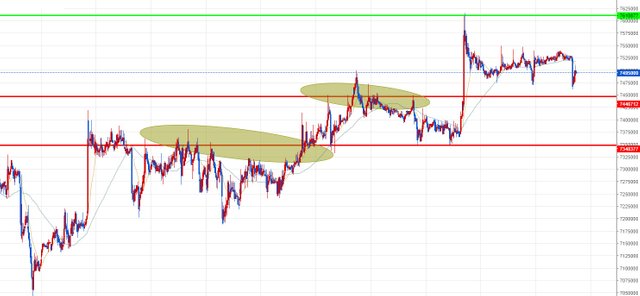
- 10minute candle chart
Following yesterday, it is being adjusted in the short term. I think it will fall to the red resistance line.
If you are approaching short-term trading, we can prepare for a loss-cut and trading on the resistance line.
It must respond to the loss-cut.
** Disclaimer: This post is a personal idea, not an investment idea. The transaction is a small transaction, so please enjoy it. It is your responsibility to invest, and you should be aware of subjective judgments and technical analysis to make investments.
Brah!